![[First]](s_first.gif)
|
![[Prev]](s_prev.gif)
|
![[Home]](s_home.gif)
|
![[Index]](s_index.gif)
|
![[Next]](s_next.gif)
|
![[Last]](s_last.gif)
|
|
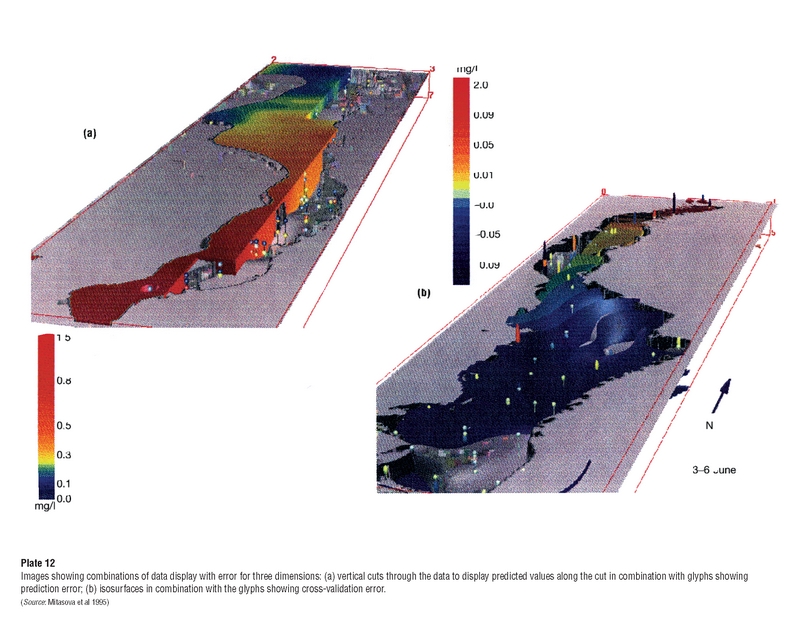
Plate 12 Images showing combinations of data display with error for three dimensions: (a) vertical cuts through the data to display predicted values along the cut in combination with glyphs showing prediction error; (b) isosurfaces in combination with the glyphs showing cross-validation error. (Source: Mitasova et al 1995) |
|