![[First]](s_first.gif)
|
![[Prev]](s_prev.gif)
|
![[Home]](s_home.gif)
|
![[Index]](s_index.gif)
|
![[Next]](s_next.gif)
|
![[Last]](s_last.gif)
|
|
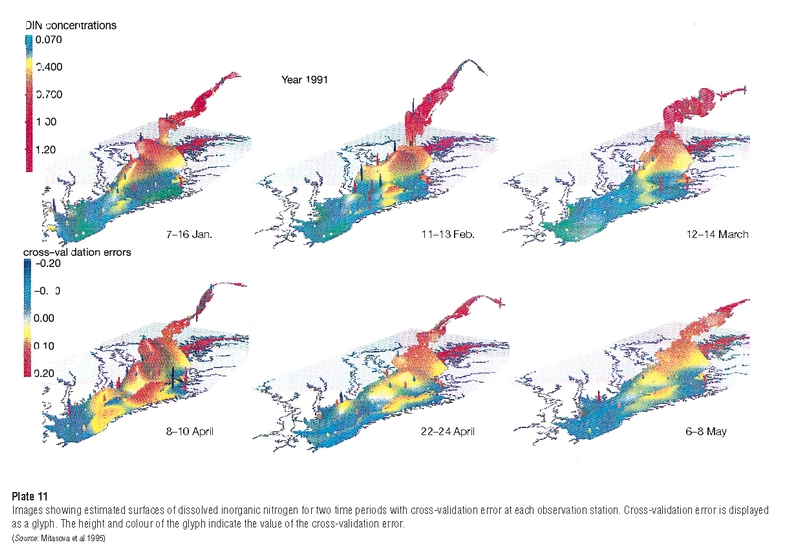
Plate 11 Images showing estimated surfaces of dissolved inorganic nitrogen for two time periods with cross-validation error at each observation station. Cross-validation error is displayed as a glyph. The height and colour of the glyph indicate the value of the cross-validation error. (Source: Mitasova et al 1995) |
|