![[First]](s_first.gif)
|
![[Prev]](s_prev.gif)
|
![[Home]](s_home.gif)
|
![[Index]](s_index.gif)
|
![[Next]](s_next.gif)
|
![[Last]](s_last.gif)
|
|
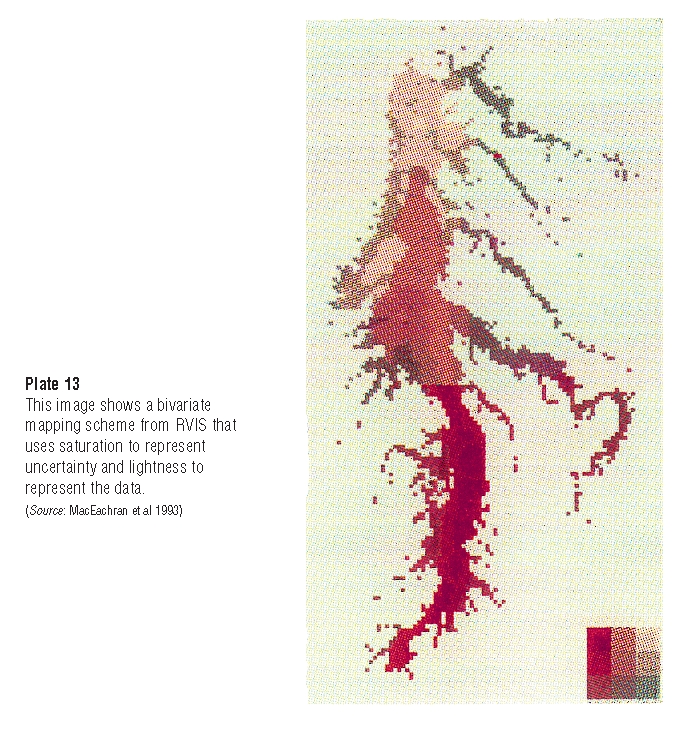
Plate 13 This image shows a bivariate mapping scheme from RVIS that uses saturation to represent uncertainty and lightness to represent the data. (Source: MacEachran et al 1993) |
|
|
|
|
|
|
|
|
|
Plate 13 This image shows a bivariate mapping scheme from RVIS that uses saturation to represent uncertainty and lightness to represent the data. (Source: MacEachran et al 1993) |
|
|