![[First]](s_first.gif)
|
![[Prev]](s_prev.gif)
|
![[Home]](s_home.gif)
|
![[Index]](s_index.gif)
|
![[Next]](s_next.gif)
|
![[Last]](s_last.gif)
|
|
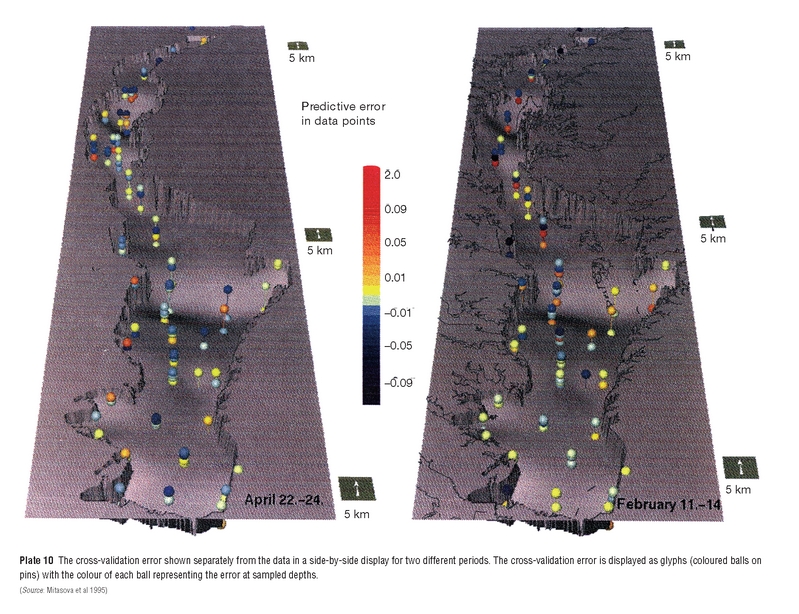
Plate 10 The cross-validation error shown separately from the data in a side-by-side display for two different periods. The cross-validation error is displayed as glyphs (coloured balls on pins) with the colour of each ball representing the error at sampled depths. (Source: Mitasova et al 1995) |
|