
A Comparison of Tropical Carbon Maps
This website explains the data behind the Tropical Carbon Map Comparison site.
What does the site show?
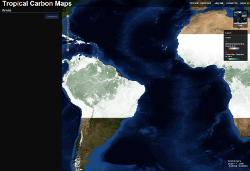
This site uses Ecometrica's Our Ecosystem to dynamically compare maps of aboveground carbon (carbon stored in woody vegetation). Currently we compare two pantropical data sets, but we hope to add many more global, regional and small-scale data sets soon. The site has advanced functionality allowing the carbon maps to be viewed and compared at a full range of resolutions, and for a specific area of interest to be queried to view the different carbon stocks predicted by the maps, partitioned into different vegetation classes.
Maps of aboveground carbon are important for a variety of reasons, including:
- To enable carbon sequestration and conservation projects to estimate a starting carbon stock for their area
- For countries preparing for REDD+ (Reducing Emissions from Deforestation and Degradation), an emerging mechanism under the UN's climate change body the UNFCCC that aims to pay developing countries to halt their deforestation
- For national parks and other conservation areas to understand better the total carbon stocks in their area, and how they are distributed
- For ecologists answering questions about ecosystem functions, total productivity, and the distribution of forest types
- For climate modelers, both to test the vegetation components of their models, and potentially to act as input data
However there are disagreements between the various maps being produced. This site does not attempt to show the 'true' carbon stocks at a location, but is a place where many maps can be interactively compared on the same scale and reports can be generated giving stocks for a particular area. We hope this will eventually lead to improvements in carbon stock maps produced, as it will allow researchers to target areas of large differences. Similarly there will be an increased confidence in using values from such maps for regions where there is a consensus between the maps.
User guide
You can find a guide to using Ecometrica's Our Ecosystem system here, and examples of other Our Ecosystem products here.
Data sources
The site currently compares two aboveground carbon maps, both produced using similar methods for the complete tropics. Click here for more details about the sources of these two maps.
We are very keen to increase the number of maps compared at the site. Please contact us if you have carbon maps or verification ground points you'd like to be included in this comparison (your raw data would remain protected on our servers, data can only be viewed, and only mean values are extracted using Our Ecosystem).