5. Getting data into LSDTopoToolbox
Before you can start analyzing topography, you will need to get data into the correct format. This page explains how to do so.
5.1. What data does LSDTopoToolbox take?
The LSDTopoToolbox works predominantly with raster data; if you don’t know what that is you can read about it here: http://en.wikipedia.org/wiki/Raster_data. In most cases, the raster data you will start with is a digital elevation model (DEM). Digital elevation models (and rasters in general) come in all sorts of formats. LSDTopoToolbox works with two formats:
- Ascii format (file extension .asc): http://docs.codehaus.org/display/GEOTOOLS/ArcInfo+ASCII+Grid+format#ASCIIGrid. This format is in plaintext and can be read by a text editor. The advantage of this format is that you can easily look at the data, but the disadvantage is that the file size is extremely large (compared to the other format, .flt).
- Float format (file extension .flt with a header file with extension .hdr). This is a binary file format meaning that you can’t use a text editor to look at the data. The file size is greatly reduced compared to .asc data, however.
- ENVI bil format (file extension .bil with a header file with extension .hdr). This is the recommended format, because it works best with GDAL (see Data preparation 2: Notes for using GDAL to manipulate files for LSDTopoToolbox), and because it retains georeferencing information. For details, see: http://www.exelisvis.com/docs/ENVIImageFiles.html
Below you will find instructions on how to get data into the correct format (we will focus on .flt and .bil format).
5.2. Data Sources
You can get topographic data from a number of sources. This is not an exhaustive list, it simply lists a few common sources. Much more data can be found via search engines.
- For LiDAR, two good sources are opentopography (http://www.opentopography.org/) and the U.S. Interagency Elevation Inventory (http://www.csc.noaa.gov/inventory/#). Other countries are not so progressive about releasing data but you could rummage around the links here: http://en.wikipedia.org/wiki/National_lidar_dataset.
- For 10m data of the United States you can go to the national map viewer (http://viewer.nationalmap.gov/viewer/). To get ordinance survey data at 10m resolution you should use Digimap (http://digimap.edina.ac.uk/digimap/home note: requires institutional subscription).
- ASTER 30m data can be obtained from NASA’s reverb site (http://reverb.echo.nasa.gov).
- One site that has filled and corrected 90-m DEMs from the SRTM mission is here: http://www.viewfinderpanoramas.org/dem3.html.
5.3. Important note on spatial reference systems
Geographic data is usually defined within a spatial reference in some way: your computer screen is flat but the Earth is a sphere so different spatial references are used to ‘project’ spherical data on a flat screen (or paper). There are two main kinds of spatial references:
- Geographic: this format retains the spherical coordinates. Usually the coordinates are given in degrees latitude and longitude.
- Projected: this projects spherical data onto a flat surface. Data is then in linear distances like metres, kilometres or miles.
The topographic measurements we use are almost always referenced to some distance so if you get data you must always transform it to a projected spatial reference. We typically project our data into the Universal Transverse Mercator (UTM) system, since it is a widely used projection system with units of metres.
5.4. Converting data from ArcMap
ArcMap is a popular GIS, we have an institutional licence at the University of Edinburgh. These instructions assume (very) basic knowledge of ArcMap.
5.4.1. Checking the spatial reference
First, load the data into ArcMap (using this:

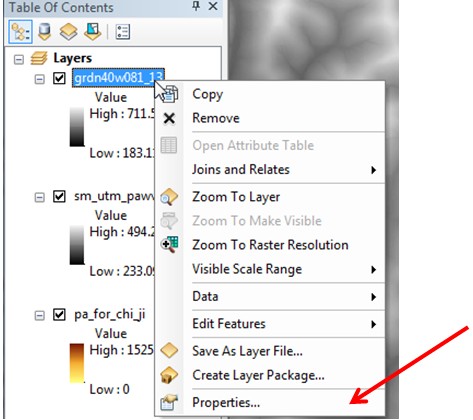
Then, right click on the data layer, and select properties:
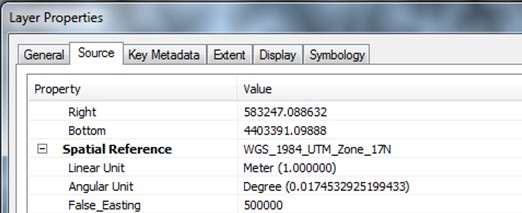
Once you’ve done that, click on the ‘source tab’ and scroll down to spatial reference:
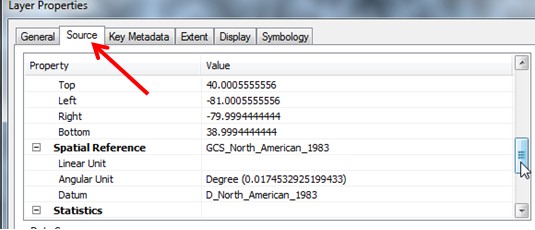
If the Spatial reference does not have a linear unit, you are in a geographic coordinate system. If you are, you need to project the data.
5.4.2. Projecting data in ArcMap
You need to use the ArcToolbox to project the data. You can get it with this button:

The project tool is in Data Management Tools -> Projections and Transformations -> Raster -> Project Raster.
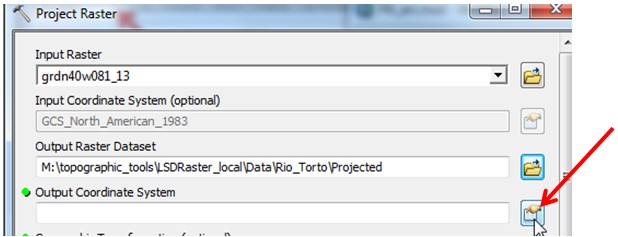
In the tool dialog, you will need to click on the button next to projection:
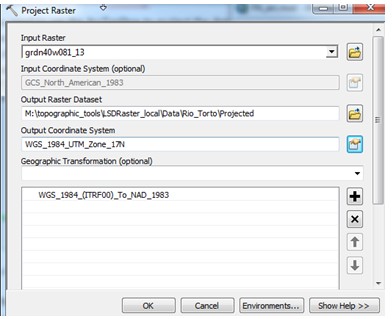
Go into projected coordinate systems , and then into UTM and then either NAD 1983 or WGS 1984 (we usually do WGS, but for most applications this won’t matter. For WGS you need to select the hemisphere:
You will get the option to select from a bunch of zones. Use this map: http://www.dmap.co.uk/utmworld.htm to select the correct zone. For example, California is zone 10 and 11. Most of Britain is zone 30. Portugal is zone 29. It is okay if your data goes slightly out of the zone you pick. The DEM in this example happens to be in Pennsylvania so it is zone 17N.
Make sure your Output raster is going somewhere sensible and then hit okay.
5.4.3. Exporting to .flt format from Arc
Make sure your DEM is in a projected coordinate system, preferably UTM. To remind you, right click on your layer, go to the source tab and scroll down to spatial reference. It should say UTM:
Once you have a projected DEM, the next step is to convert it into float format. The Edinburgh software reads ONLY float, ascii and .bil format DEMs, and ascii DEMs are huge and are not recommended. We have retained this format only for the purposes of bug-checking. To convert a DEM into float format in ArcMap use the Conversion Tools -> From Raster -> Raster to Float tool
The float DEM is comprised of 2 files: one with the extension flt and one with the extension hdr. You will need both of these files.
5.4.4. Exporting to ENVI .bil format from Arc THIS IS THE PREFERRED FORMAT
Make sure your DEM is in a projected coordinate system, preferably UTM. To remind you, right click on your layer, go to the source tab and scroll down to spatial reference. It should say UTM:
Once you have a projected DEM, the next step is to convert it into ENVI bil format. IMPORTANT ESRI (the people who make ArcMap) have a bil format. This is not to be confused with ENVI bil format.
To convert a DEM into bil format in ArcMap use the Conversion Tools -> From Raster -> Raster to Other formats Here is a description.
The float DEM is comprised of 2 files: one with the extension bil and one with the extension hdr. You will need both of these files.
5.5. Conversion of formats using QGIS
QGIS is an open source GIS package.
When you install QGIS you also get GDAL. If you are working in Linux we highly recommend just working with GDAL directly (see Data preparation 2: Notes for using GDAL to manipulate files for LSDTopoToolbox), bit this is not so trivial in Windows environments.
One option is to use QGIS to get at the GDAL conversion tools.
First, load your DEM.
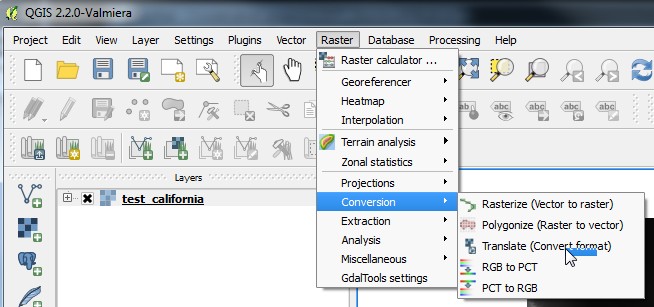
Next, go to the raster menu, then to conversion, and then to translate:
You will get a dialog box. YOU ARE GOING TO IGNORE MOST OF THIS BOX
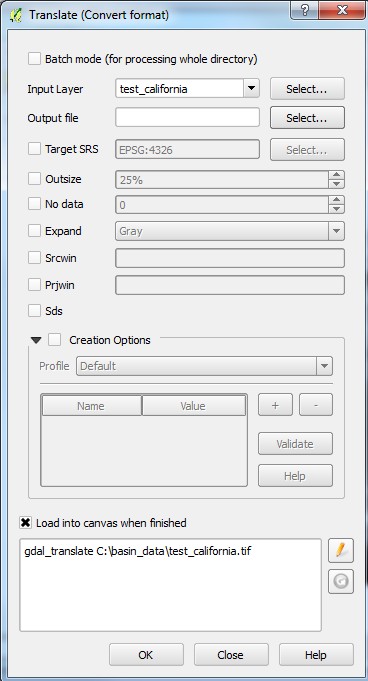
The reason you will ignore most og this box is because, although GDAL has options for ENVI bil files, the dialog box in QGIS doesn’t let you select this format (or at least not in version 2.2).
Instead of selecting filenames from a menu, you are going to input a GDAL command in the box at the bottom of the dialog box. First, click on ‘edit’ button next to the text box at the bottom of the translate dialog box:
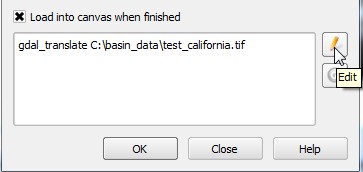
You need to edit this box following the gdal command line syntax. You can read all about that (see Data preparation 2: Notes for using GDAL to manipulate files for LSDTopoToolbox) later, but for now all you need to know is that you need to i) include the text -of ENVI after gdal_translate, and then write the name of the file to be saved at the end of the line. For example, you could write:
gdal_translate -of ENVI C:\basin_data\test_california.tif C:\basin_data\test_california.bil
Like this:
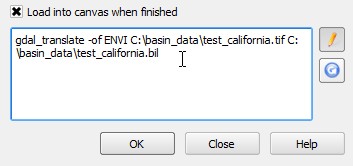
QGIS doens’t quite know what to do when you override its options by typing directly into the text box, so it will tell you that the process hasn’t worked. But if you formatted the text box correctly, it will have worked! That is DON’T TRUST THE WARNING, you should have a new ENVI bil file in the folder you have chosen.
5.6. Conversion of float files to other formats using GDAL
GDAL is a library for geospatial data that is commonly used in the GeoSciences. If you have GDAL, you most likeley have the GDAL utilities. GDAL can recognize the .flt format, so you can convert this to other formats such as geotiff using the GDAL_translate utility. The syntax for this is:
gdal_translate -of GTiff mandakini.flt mandakini.tiffIn this example a flt file is translated to a tiff file.
For much more information about using GDAL in conjunction with LSDTopoToolbox go to the next section Data preparation 2: Notes for using GDAL to manipulate files for LSDTopoToolbox.
5.7. Data Visualisation options
There are several options for visualising datasets. We use a combination of ArcMap and the MatPlotLib package in python for visualisation. In some cases it is useful to quickly plot a raster and inspect its data elements. The MatplotLib imshow() routine can quickly show data but doesn’t allow pixel inspection, whereas ArcMap requires a license, and can be slow to load. One solution is to use imageJ, which is a java package, which is cross platform, for image visulisation.
imageJ does not read flt files, so it will be necessary to convert to tiff format, using gdal_translate, before viewing the rasters.