
Enhanced Population Estimation beyond Counts: Modelling Age Patterns
Noée Szarka
Introduction
Fine-scale population distribution and demographic knowledge are essential to support efficient urban monitoring, planning and decision making (Wu et al., 2020). In particular, urban areas face many future challenges concerning rapidly growing and ageing societies. Recent studies have extensively disaggregated population counts, while information on demographic measures including age have remained unattended with a few exceptions (i.e. Alegana et al., 2015). This research has an exploratory nature and focuses on disaggregation in a highly urban area, where established methods often reach their limits due to the surface’s and buildings’ structure (Bakillah et al., 2014; Biljecki et al., 2016). The novelty of this approach is twofold: first, we aim to estimate demographic patterns by point features only (real estate data including meta-information and POI) using machine learning algorithms, and second, we intend to predict not only population counts, but also average age and the proportion of the elderly (65 years and older) per area.
Methods
The study area enfolds the so-called HDB (Housing & Development Board) Towns and Estates in the city-state Singapore in Southeast Asia. The census data has been transformed to retrieve the relevant numbers (i.e. age groups, average age). Data on environmental amenities (POI) and real estate was available from different governmental agencies and needed to be geocoded via Google Geocode API in R, if no spatial reference was given. These files could be then intersected by administrative boundaries.
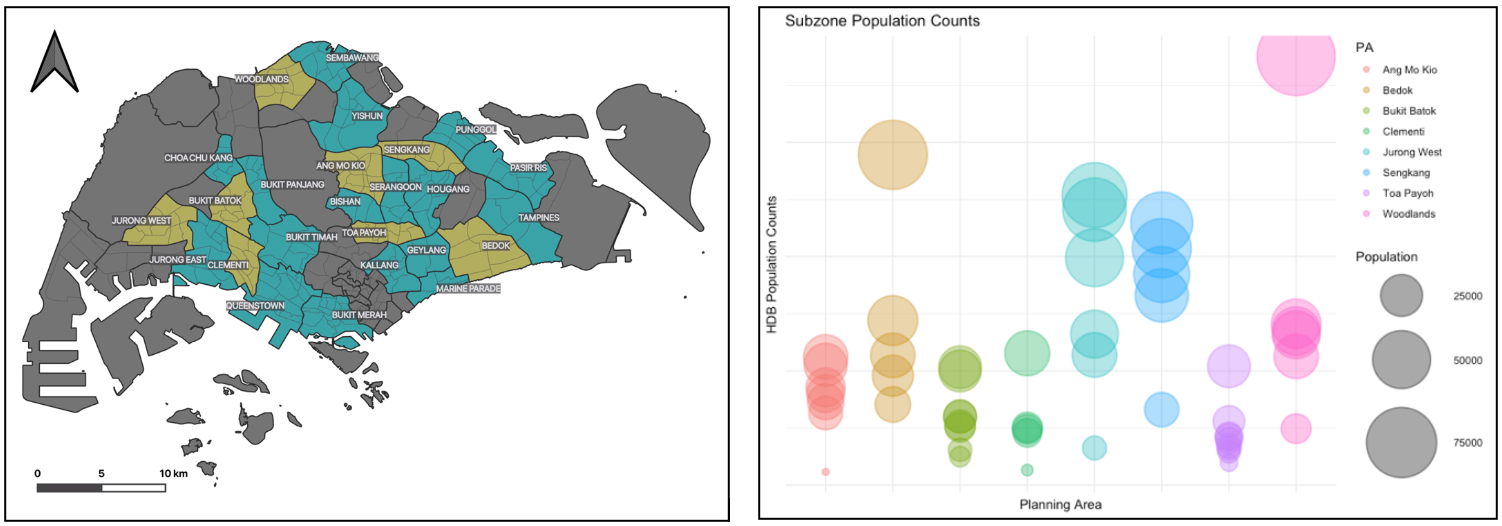
Fig. 1 (left). Research Planning Areas (thick lines) including their Subzones (thin lines) in Singapore, which are part of HDB Towns. The yellow areas are part of the training group, while the turquoise zones are the target areas (estimations).
Fig. 2 (right). HDB population counts of Subzones within their respective Planning Areas for the training dataset.
The regression models have been developed in R Studio with the caret (Classification and Regression Training) package, namely Random Forest (RF, based on decision trees), Support Vector Machines (SVM, based on hyperplanes and support vectors) and Linear Regression (LM) (Kuhn, 2019). The models have been validated (pre-testing), tuned and tested (testing). By comparing the outcomes, the two best performing models for each prediction have been identified for the final estimations of population counts, average age and elderly proportion.
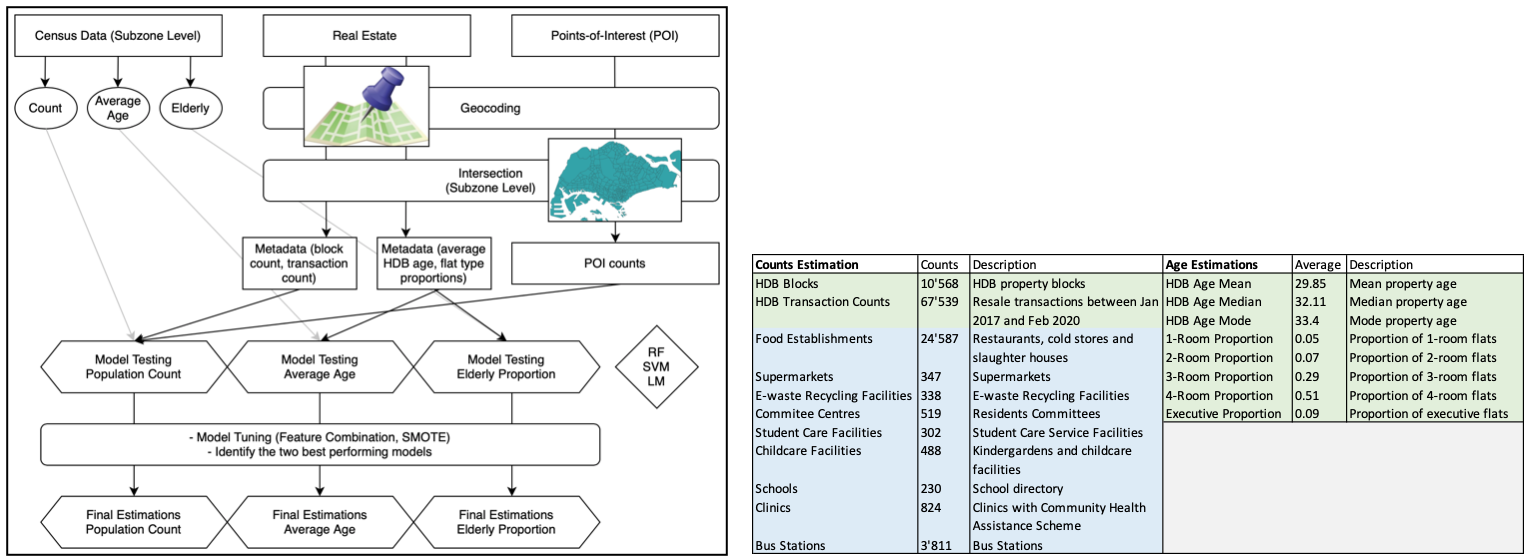
Fig. 3 (left). Flowchart of the method and the employed datasets.
Table 1 (right). An overview of the predictors and their overall counts/average values. HDB (real estate) variables are highlighted in green, POI in blue. The left column contains the predictors for population counts, the right column for age estimations (average age and elderly proportion).
Results and Discussion
Compared to previous studies in estimating population counts by ML-methods, we derived an eminently high R-squared value (97.6%) and a convincing MAPE (15.7%). Moreover, the correlation coefficient (98.8%) indicates a nearly perfect linear relationship between our estimations and the observed values.
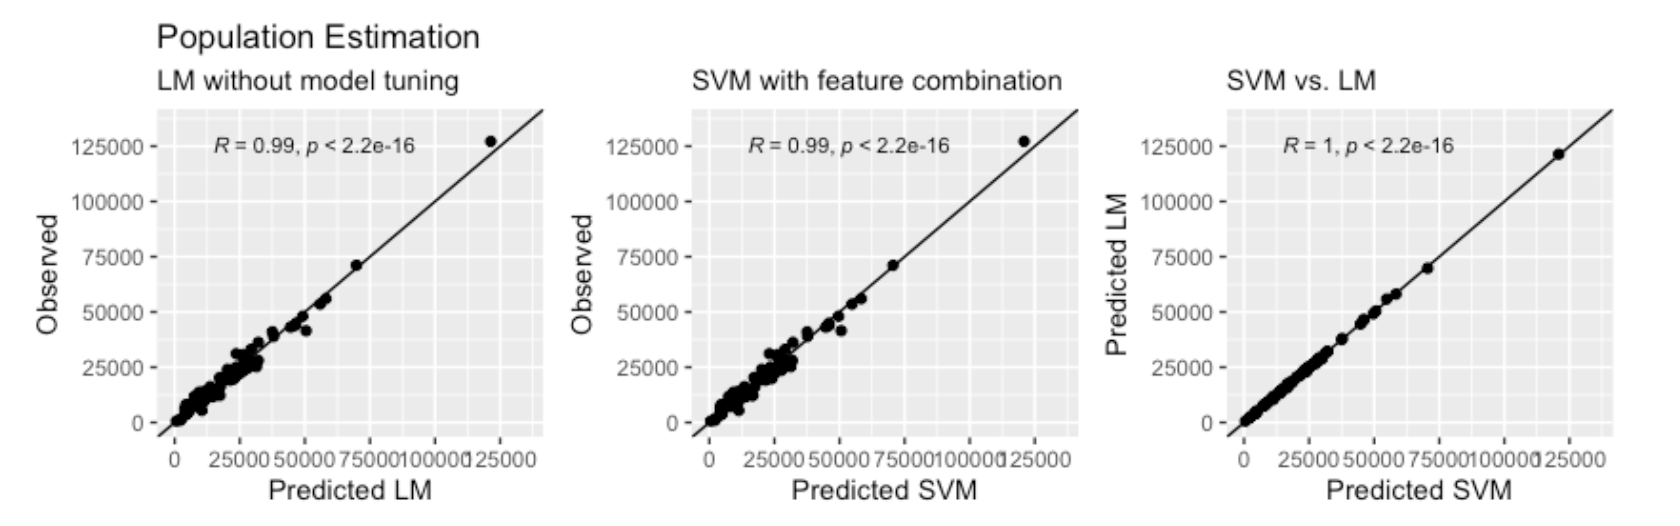
Fig.
4. Observed vs. Predicted and Predicted vs. Predicted (Models)
scatterplots for population counts.
In contrast to population disaggregation, we have broken new ground by estimating average age and elderly proportions. The R-squared values are still significant (71.9% elderly proportion, and 76,8% average age), with correlation coefficients revealing a strong relationship between our predicted and observed numbers (84.8% elderly proportion, and 87.7% average age).
Linear Regression has proven to perform best and most constantly throughout the predictions, while Random Forest and Support Vector Machines are more sensitive to the training data. Our results reveal that there is a strong relationship between a) population counts and the number of POI and information on real estate (block and transaction counts), and b) age distributions and real estate metadata (property age and flat type).
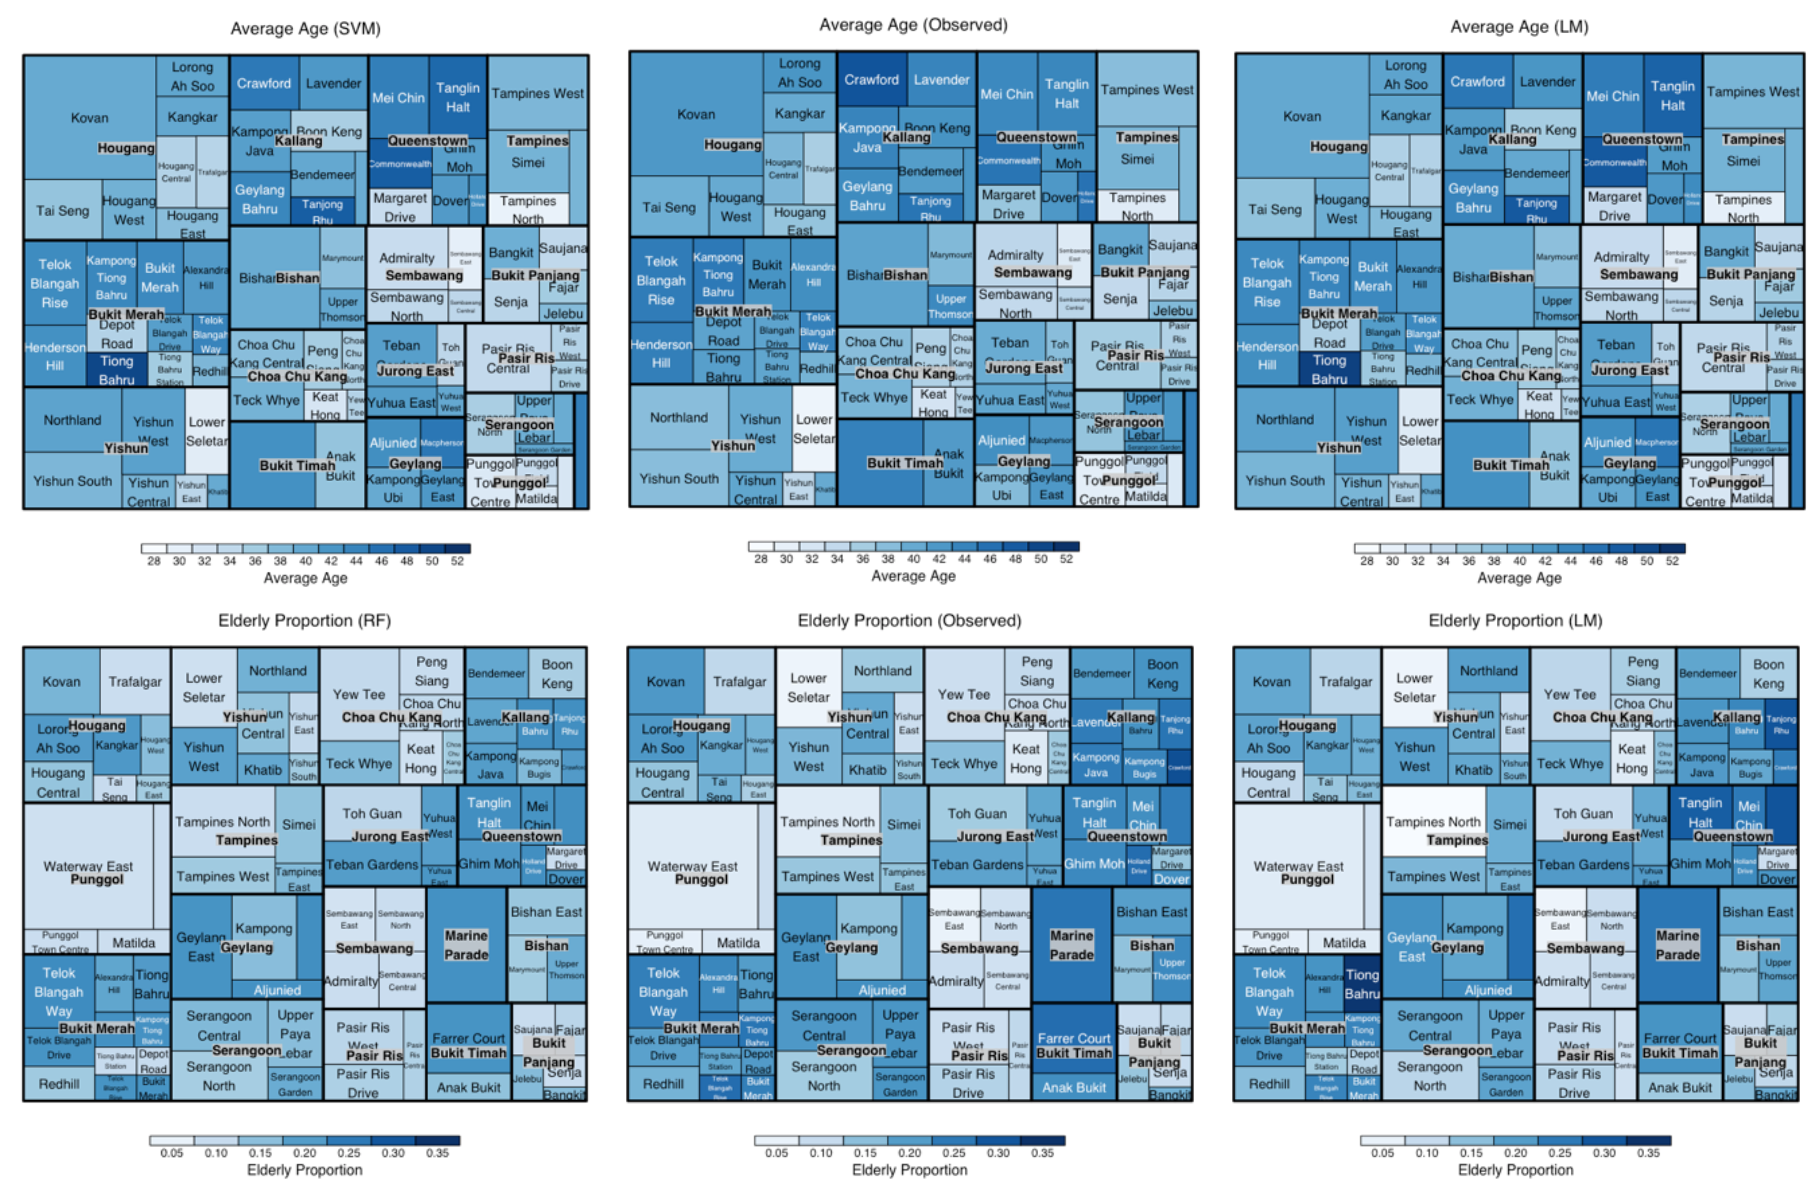
Fig. 5. Treemaps of the final estimations of age patterns in SG Subzones. For comparison, the observed values are in the middle column, while the LM model can be found on the right. The areas of the Planning Areas are represented by the square dimensions, while Subzones are grouped within their respective Planning Area. The zones are coloured according to average age (top row) and elderly proportion (bottom row).
Conclusion
This study highlights the ability of ML-algorithms to estimate population counts, average age, and elderly proportion by spatially detailed knowledge on POI and real estate data. We have compared three different models (RF, SVM and LM) with different tuning parameters, and have successfully extended previous population predictions by deriving deeper knowledge on demographic dispersions, which are vital for urban planners and policy makers.
References
Alegana, V. A., Atkinson, P., Pezzulo, C., Sorichetta, A., Weiss, D., Bird, T., Erbach-Schoenberg, E. and Tatem, A. J. (2015) ‘Fine resolution mapping of population age-structures for health and development applications’, Journal of the Royal Society Interface, 12, pp. 1–11.
Bakillah, M., Liang, S., Mobasheri, A., Arsanjani, J. J. and Zipf, A. (2014) ‘Fine-resolution population mapping using OpenStreetMap points-of-interest’, International Journal of Geographical Information Science, 28(9), pp. 1940–1963.
Biljecki, F., Ohori, K. A., Ledoux, H., Peters, R. and Stoter, J. (2016) ‘Population Estimation Using a 3D City Model: A Multi-Scale Country-Wide Study in the Netherlands’, PLoS ONE, 11(6), pp. 1–22.
Kuhn, M. (2019) The caret Package, GitHub. Available at: http://topepo.github.io/caret/index.html.
Wu, T., Luo, J., Dong, W., Gao, L., Hu, X., Wu, Z., Sun, Y. and Liu, J. (2020) ‘Disaggregating County-Level Census Data for Population Mapping Using Residential Geo-Objects with Multisource Geo-Spatial Data’, IEEE Journal of Selected Topics in Applied Earth Observations and Remote Sensing, 13, pp. 1189–1205.