
Context
Central America suffers from devastating flooding due to tropical cyclone activity every year. With an increase in the probability of more severe precipitation events predicted by multiple climate change models, the need to accurately and efficiently identify regions at risk of flood damage is strong. However, the influence of spatial variability of precipitation data applied to hydrodynamic flow simulations remains largely unexplored.
With cyclonic precipitation possessing such a distinctive morphology, this study aimed to identify to what extent spatially variable cyclone precipitation is more realistic in hydrodynamic flow modelling for flood prediction mapping, compared to uniform precipitation, for a catchment in southwest Mexico. The data-sparse region was additionally used as an investigation into the powers and limitations of remote sensing data in flood prediction, as opposed to field data ratification.
Location of study and outline of data coverage in the Tlapa de Comonfort municipality of Guerrero, Mexico.
Menu
Methods
 |
 |
 |
 |
 |
 |
The study used topographic data of 5m cell resolution derived from LiDAR and a novel algorithm from Clubb, et al., (2017), to objectively delineate floodplains to act as high-risk areas of the large catchment. The topographic data was then fed into the HAIL-CAESAR hydrodynamic flow algorithm, a cellular automaton model that calculates floodwater depth and extent across every cell in the DEM for each defined timestep.
On the 13th September 2017 a Category 1 cyclone called Hurricane Max developed off the south coast of Mexico and travelled northeastward, releasing 300mm of rainfall from 13th-15th September across eastern Guerrero. Precipitation data from this event was applied to the model, sourced from NASA’s GPM data which provides global rasters of rainfall rate every 30 minutes at 10km cell resolution. The precipitation data was area-averaged to also give a uniform rainfall dataset.
A Sentinel-2 multispectral satellite image was then used to compare the results of the simulated flood extents from both uniform and spatially variable rainfall scenarios to real floodwater data. A modified Normalised Difference Water Index (NDWI) was used to automatically extract water extent from this satellite image captured on the 19th September 2017.
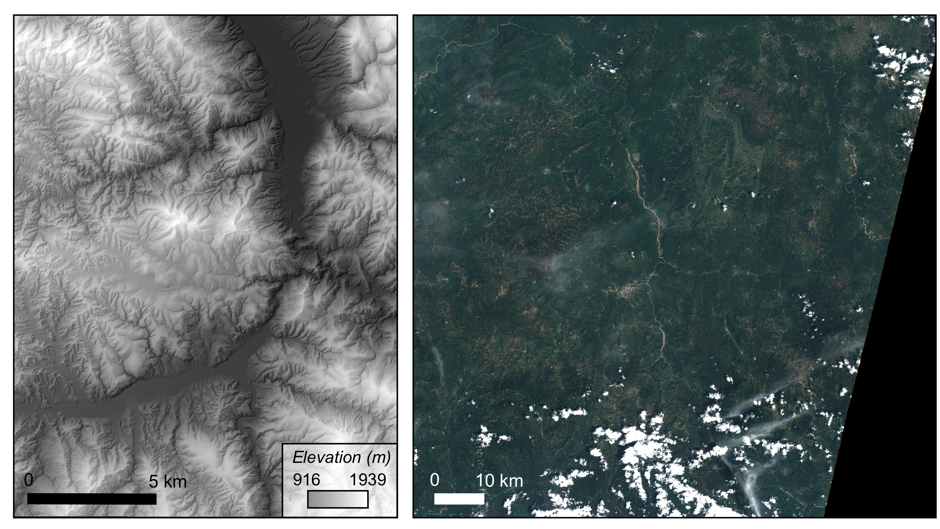
The LiDAR-derived topography dataset (left) and the Sentinel-2B multispectral image in true colour (right)
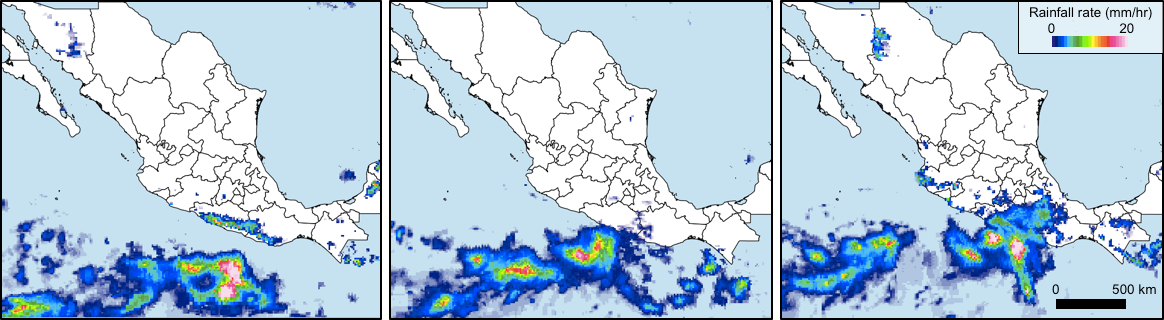
Example GPM rasters showing rainfall rate over southern Mexico at 0000 and 1200 UTC on 13th September and 0000 UTC on 14th (left to right)
Menu
Results
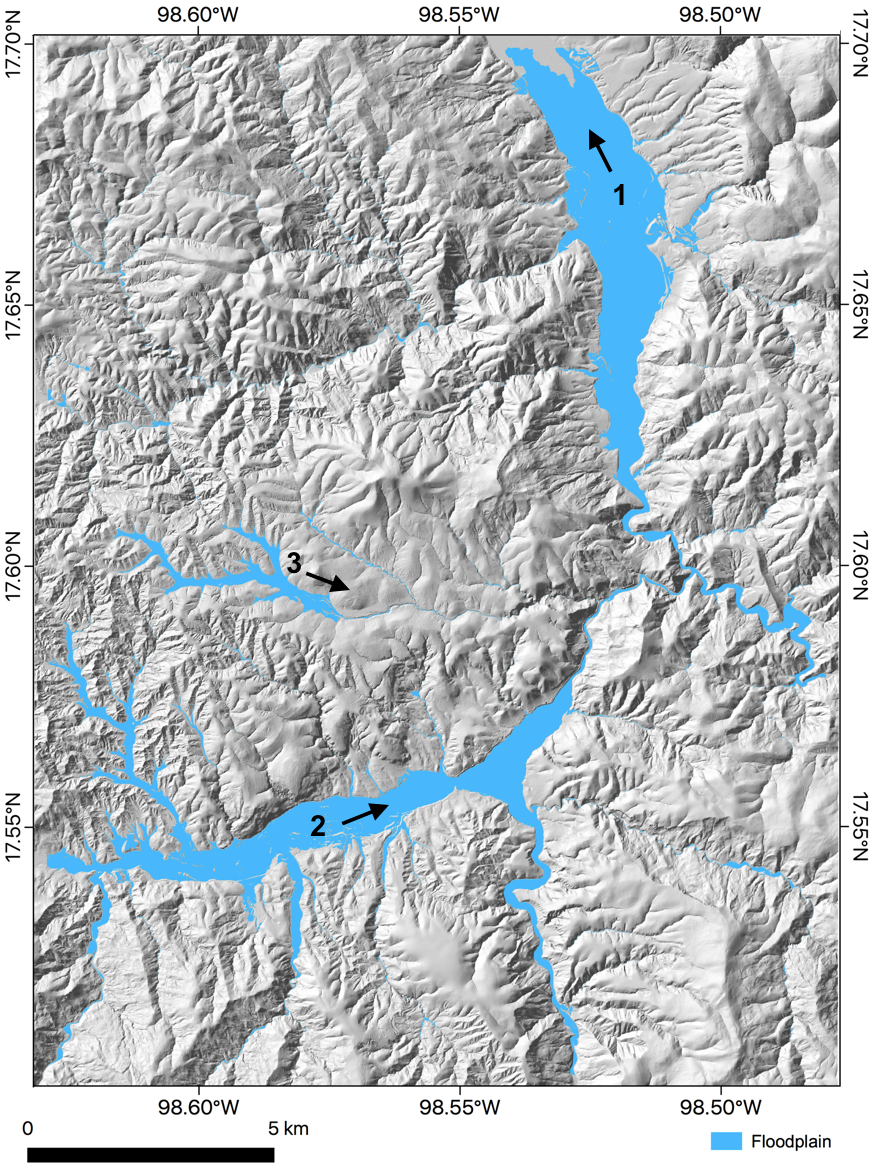
Resulting floodplains delineated using objective thresholding of elevation above nearest channel and local gradient
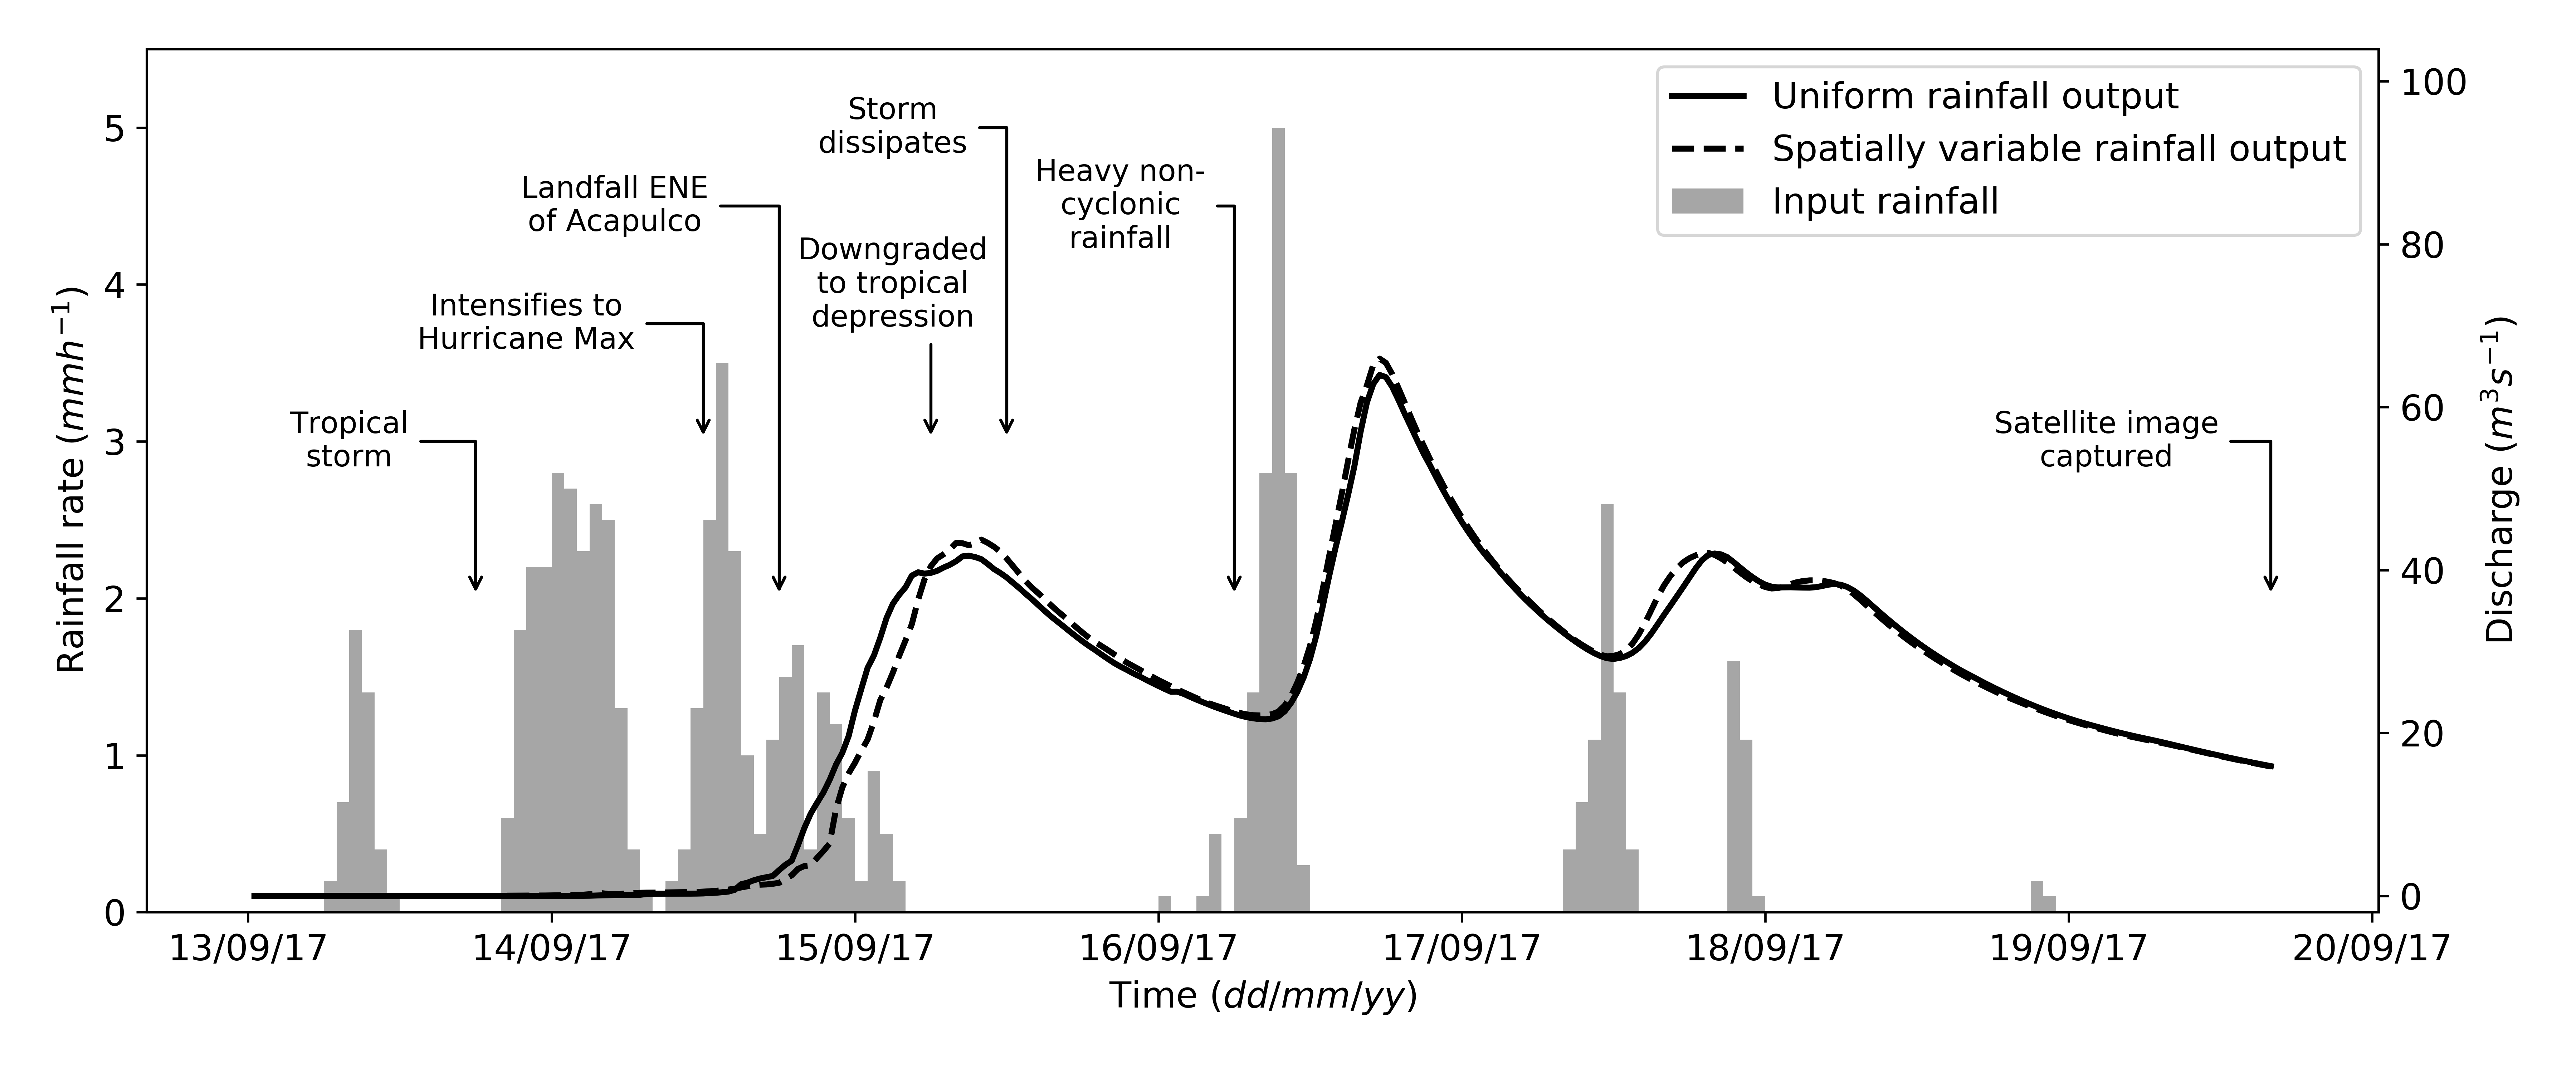
Simulated hydrographs for uniform and spatially variable input rainfall scenarios, plotted alongside rainfall rate for the duration of Hurricane Max until the time of the Sentinel-2B satellite image capture
 |
 |
|---|---|
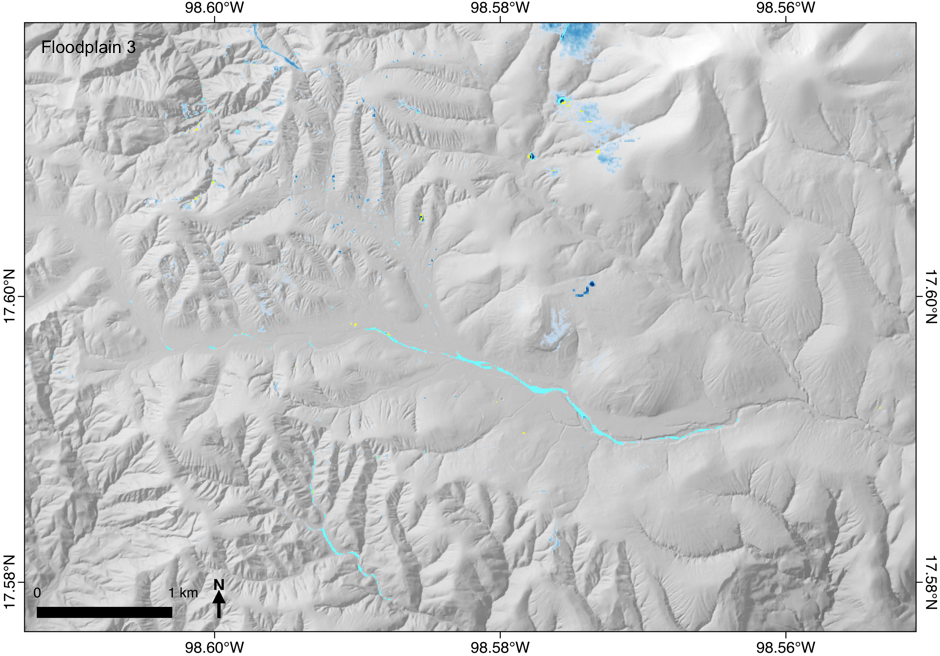 |
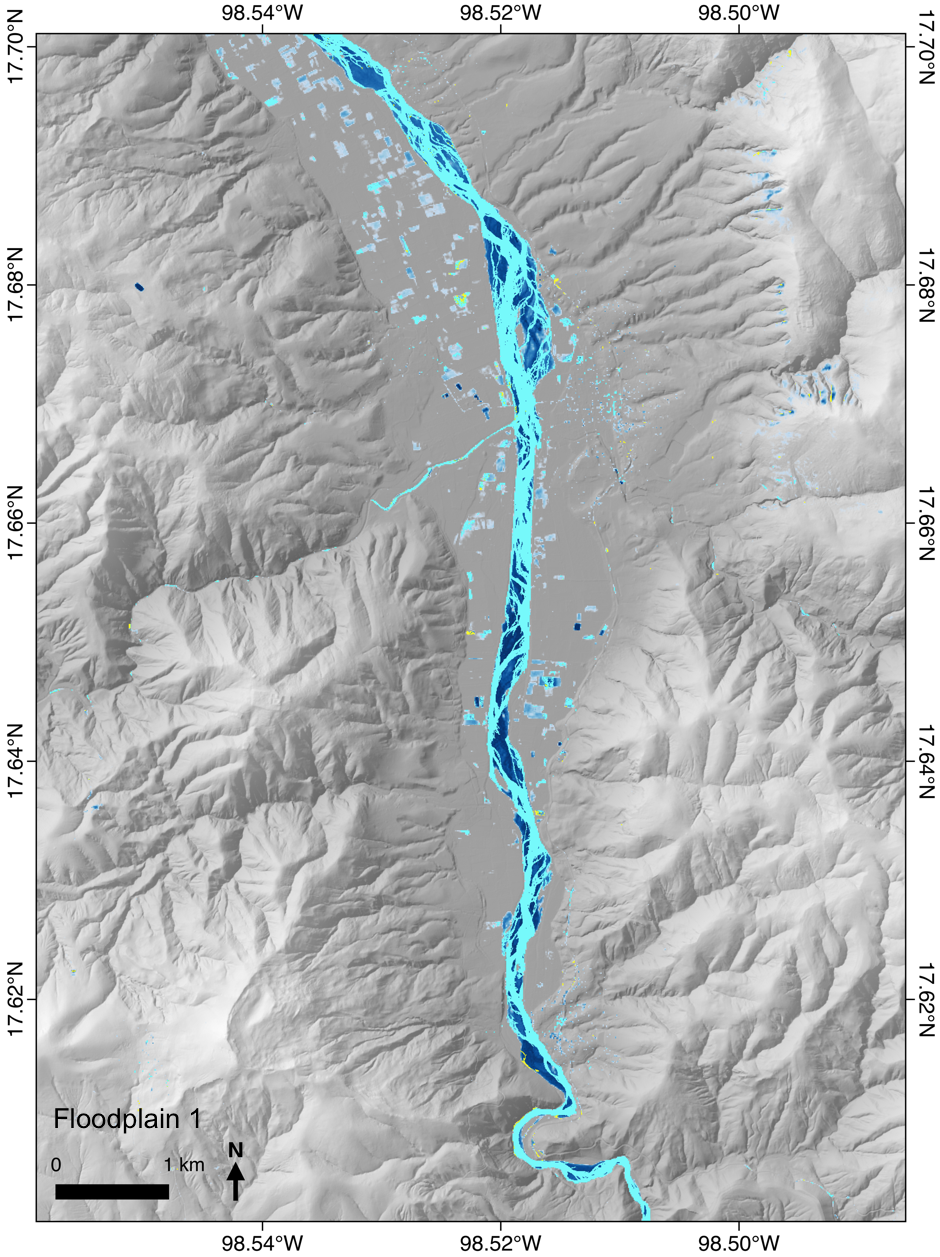
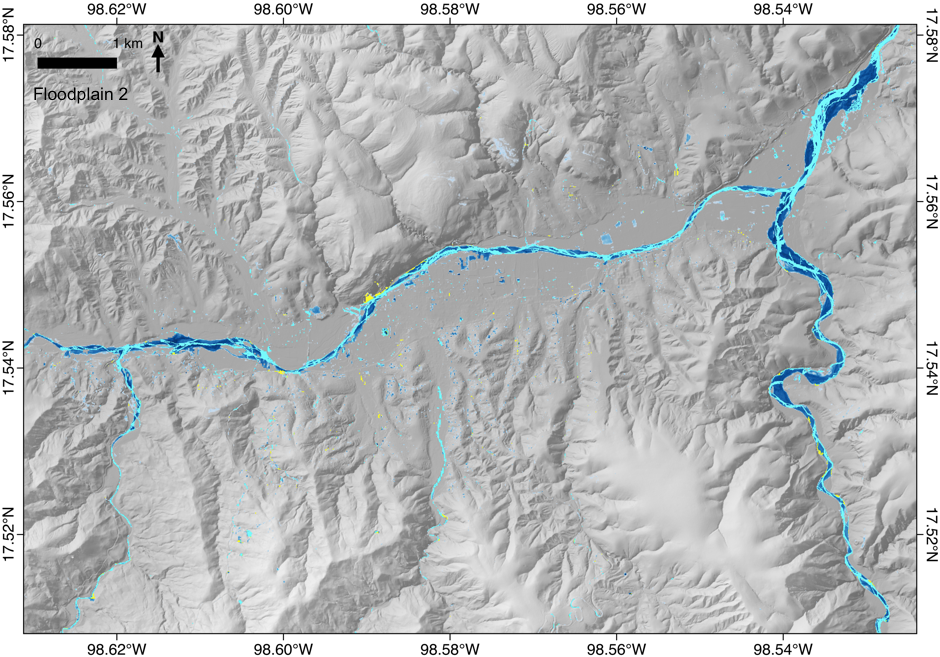
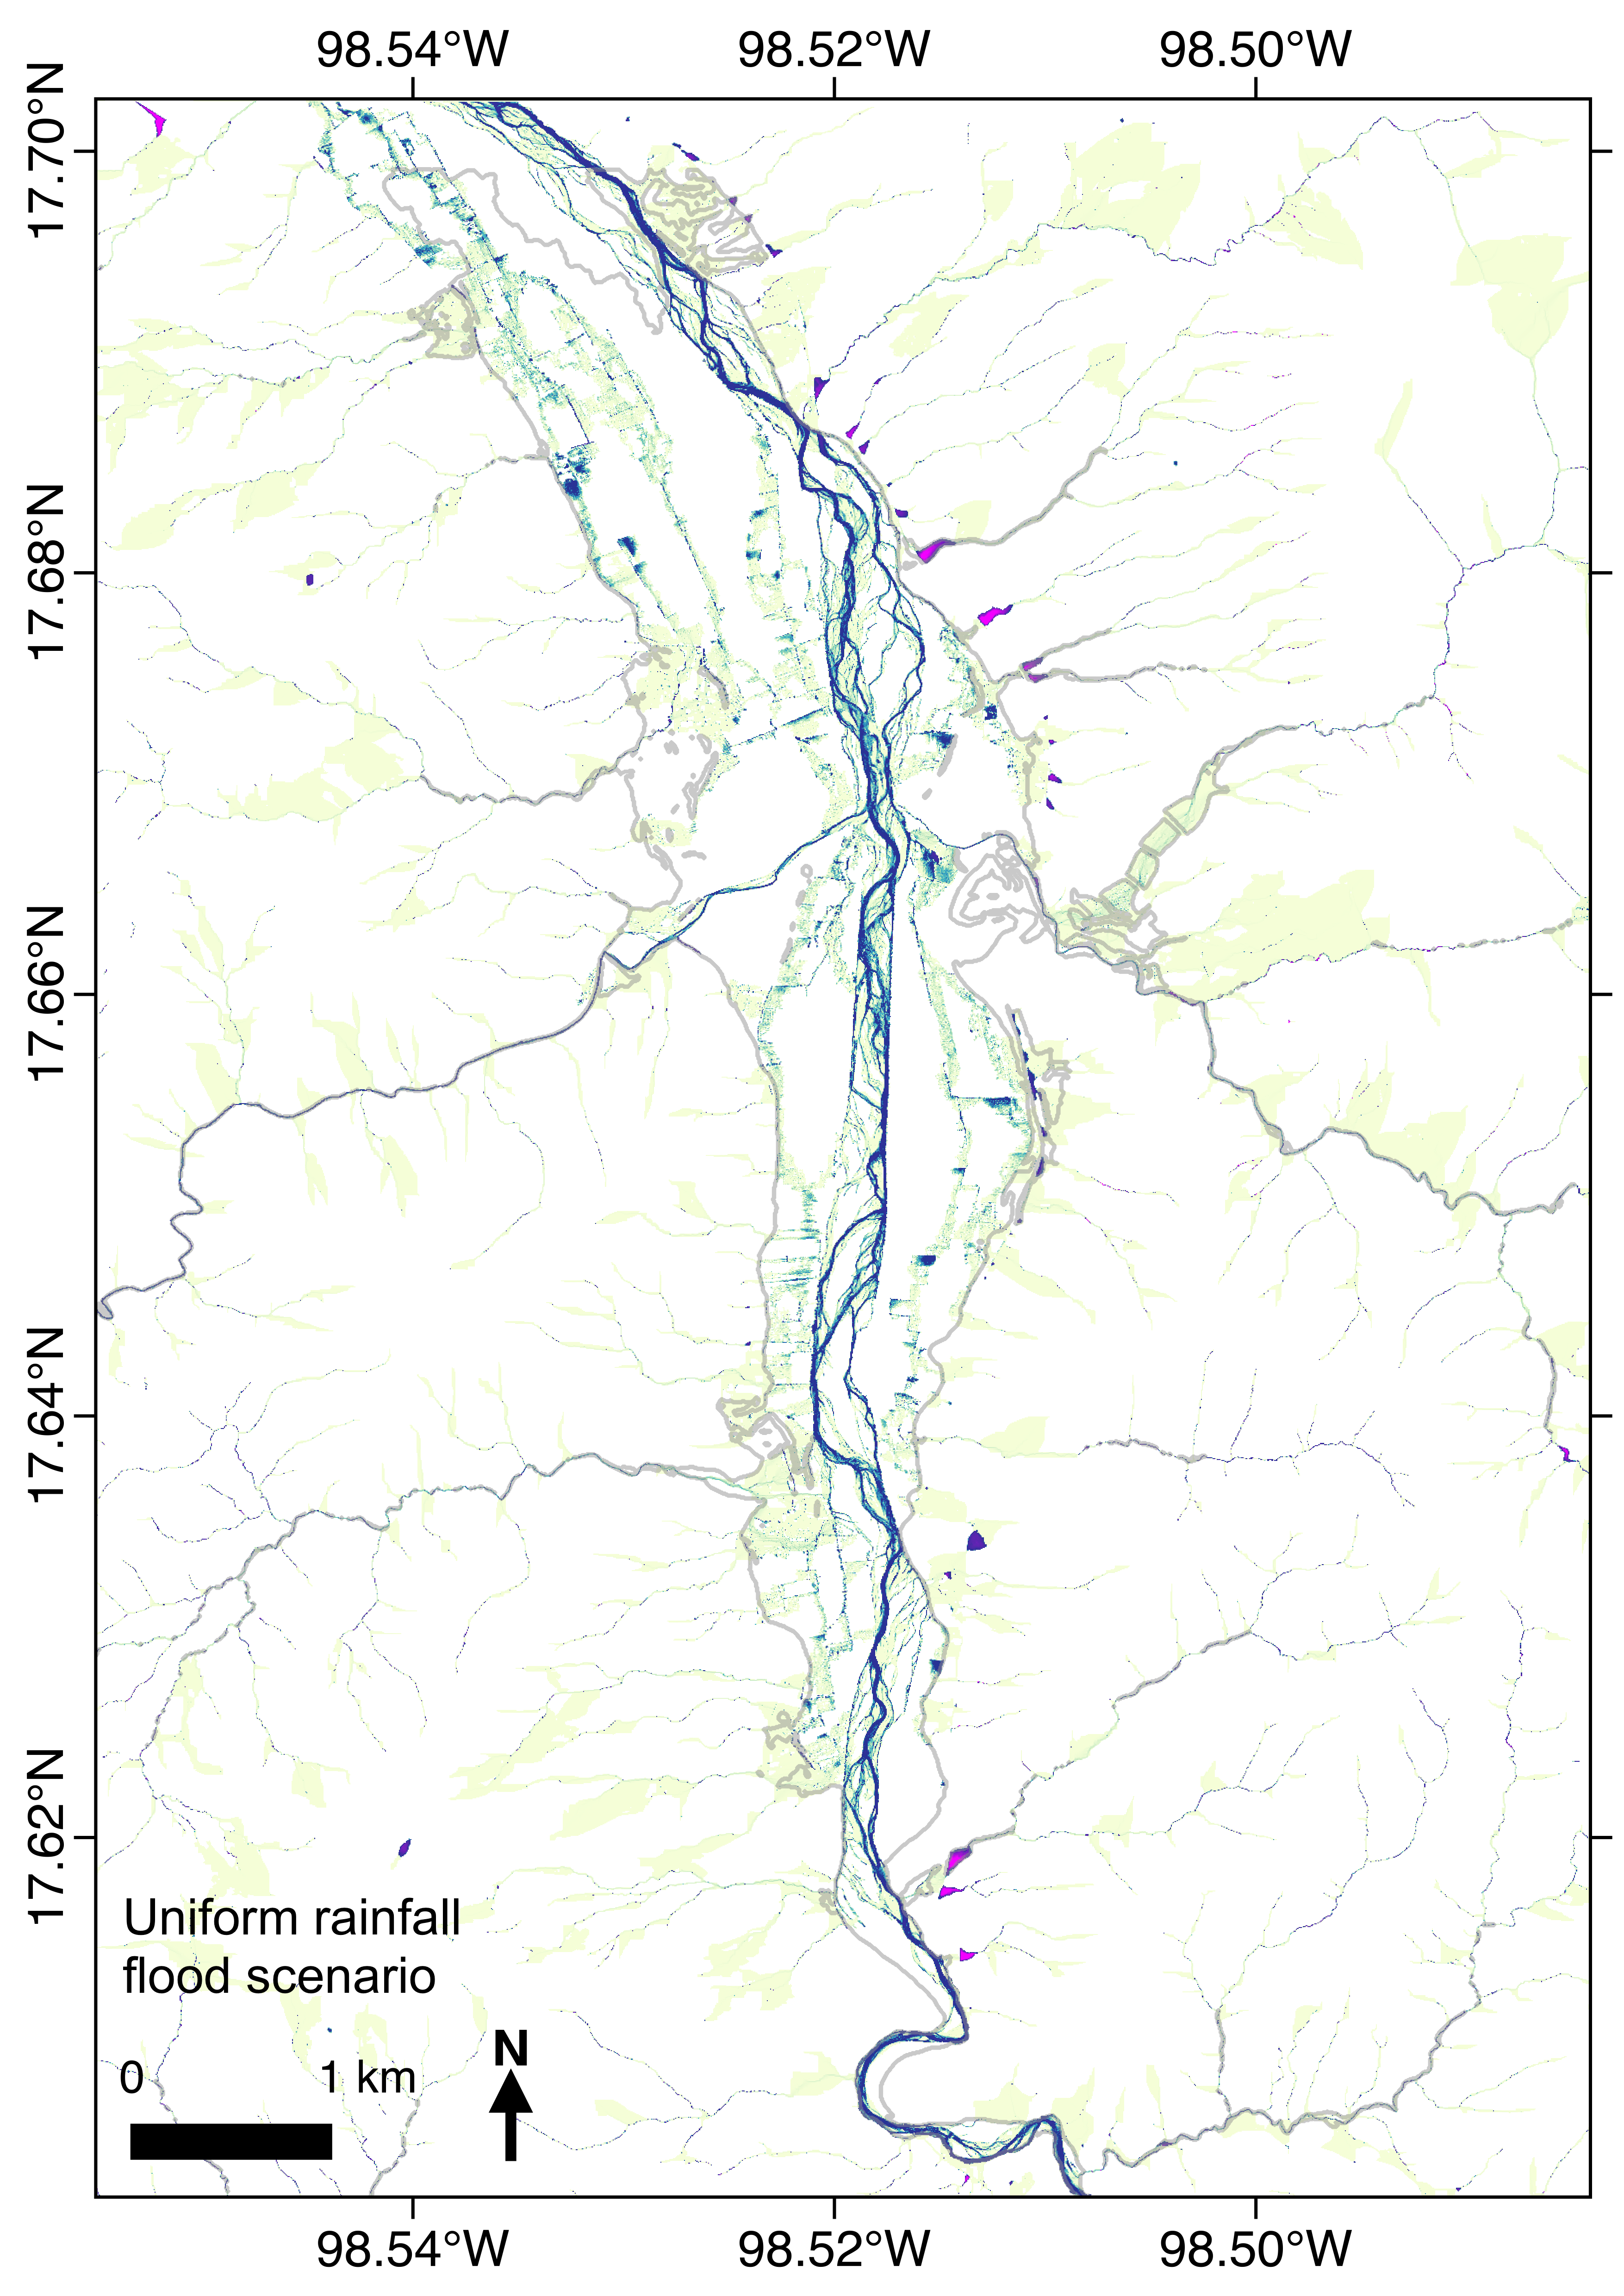
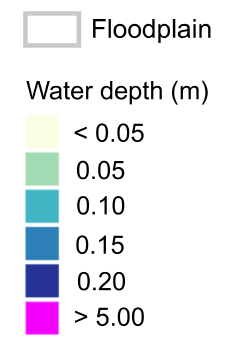
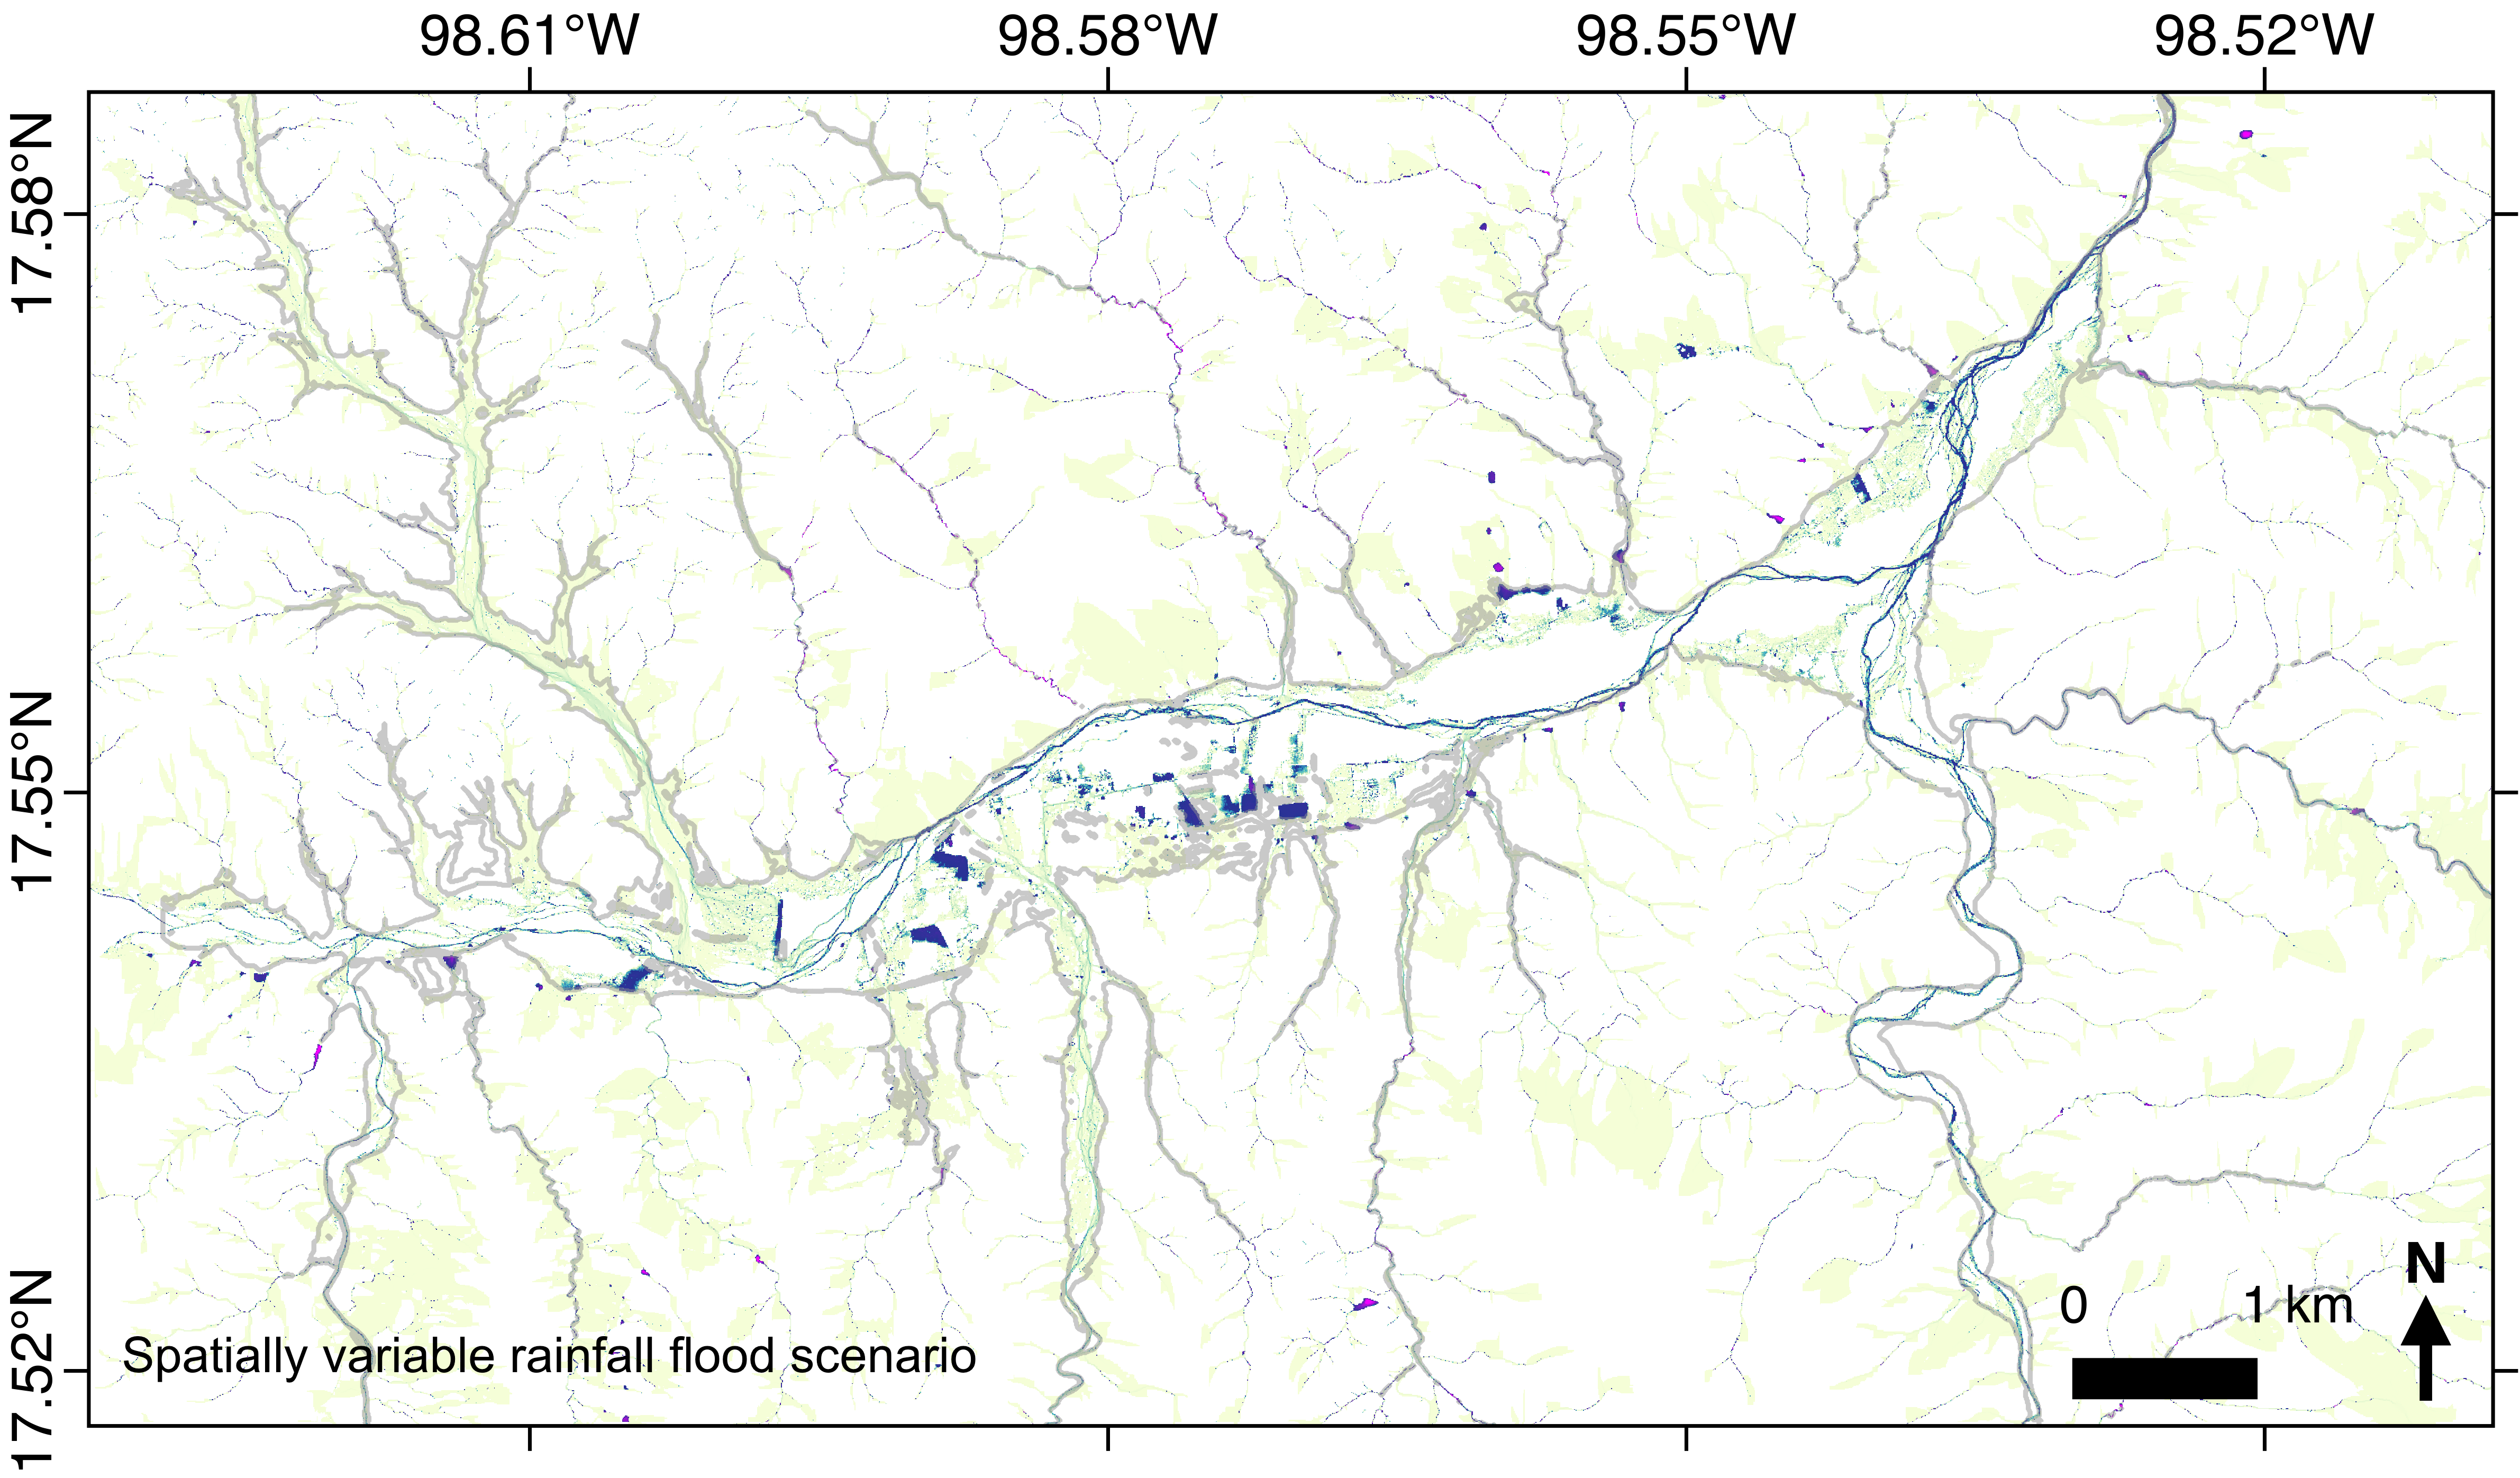
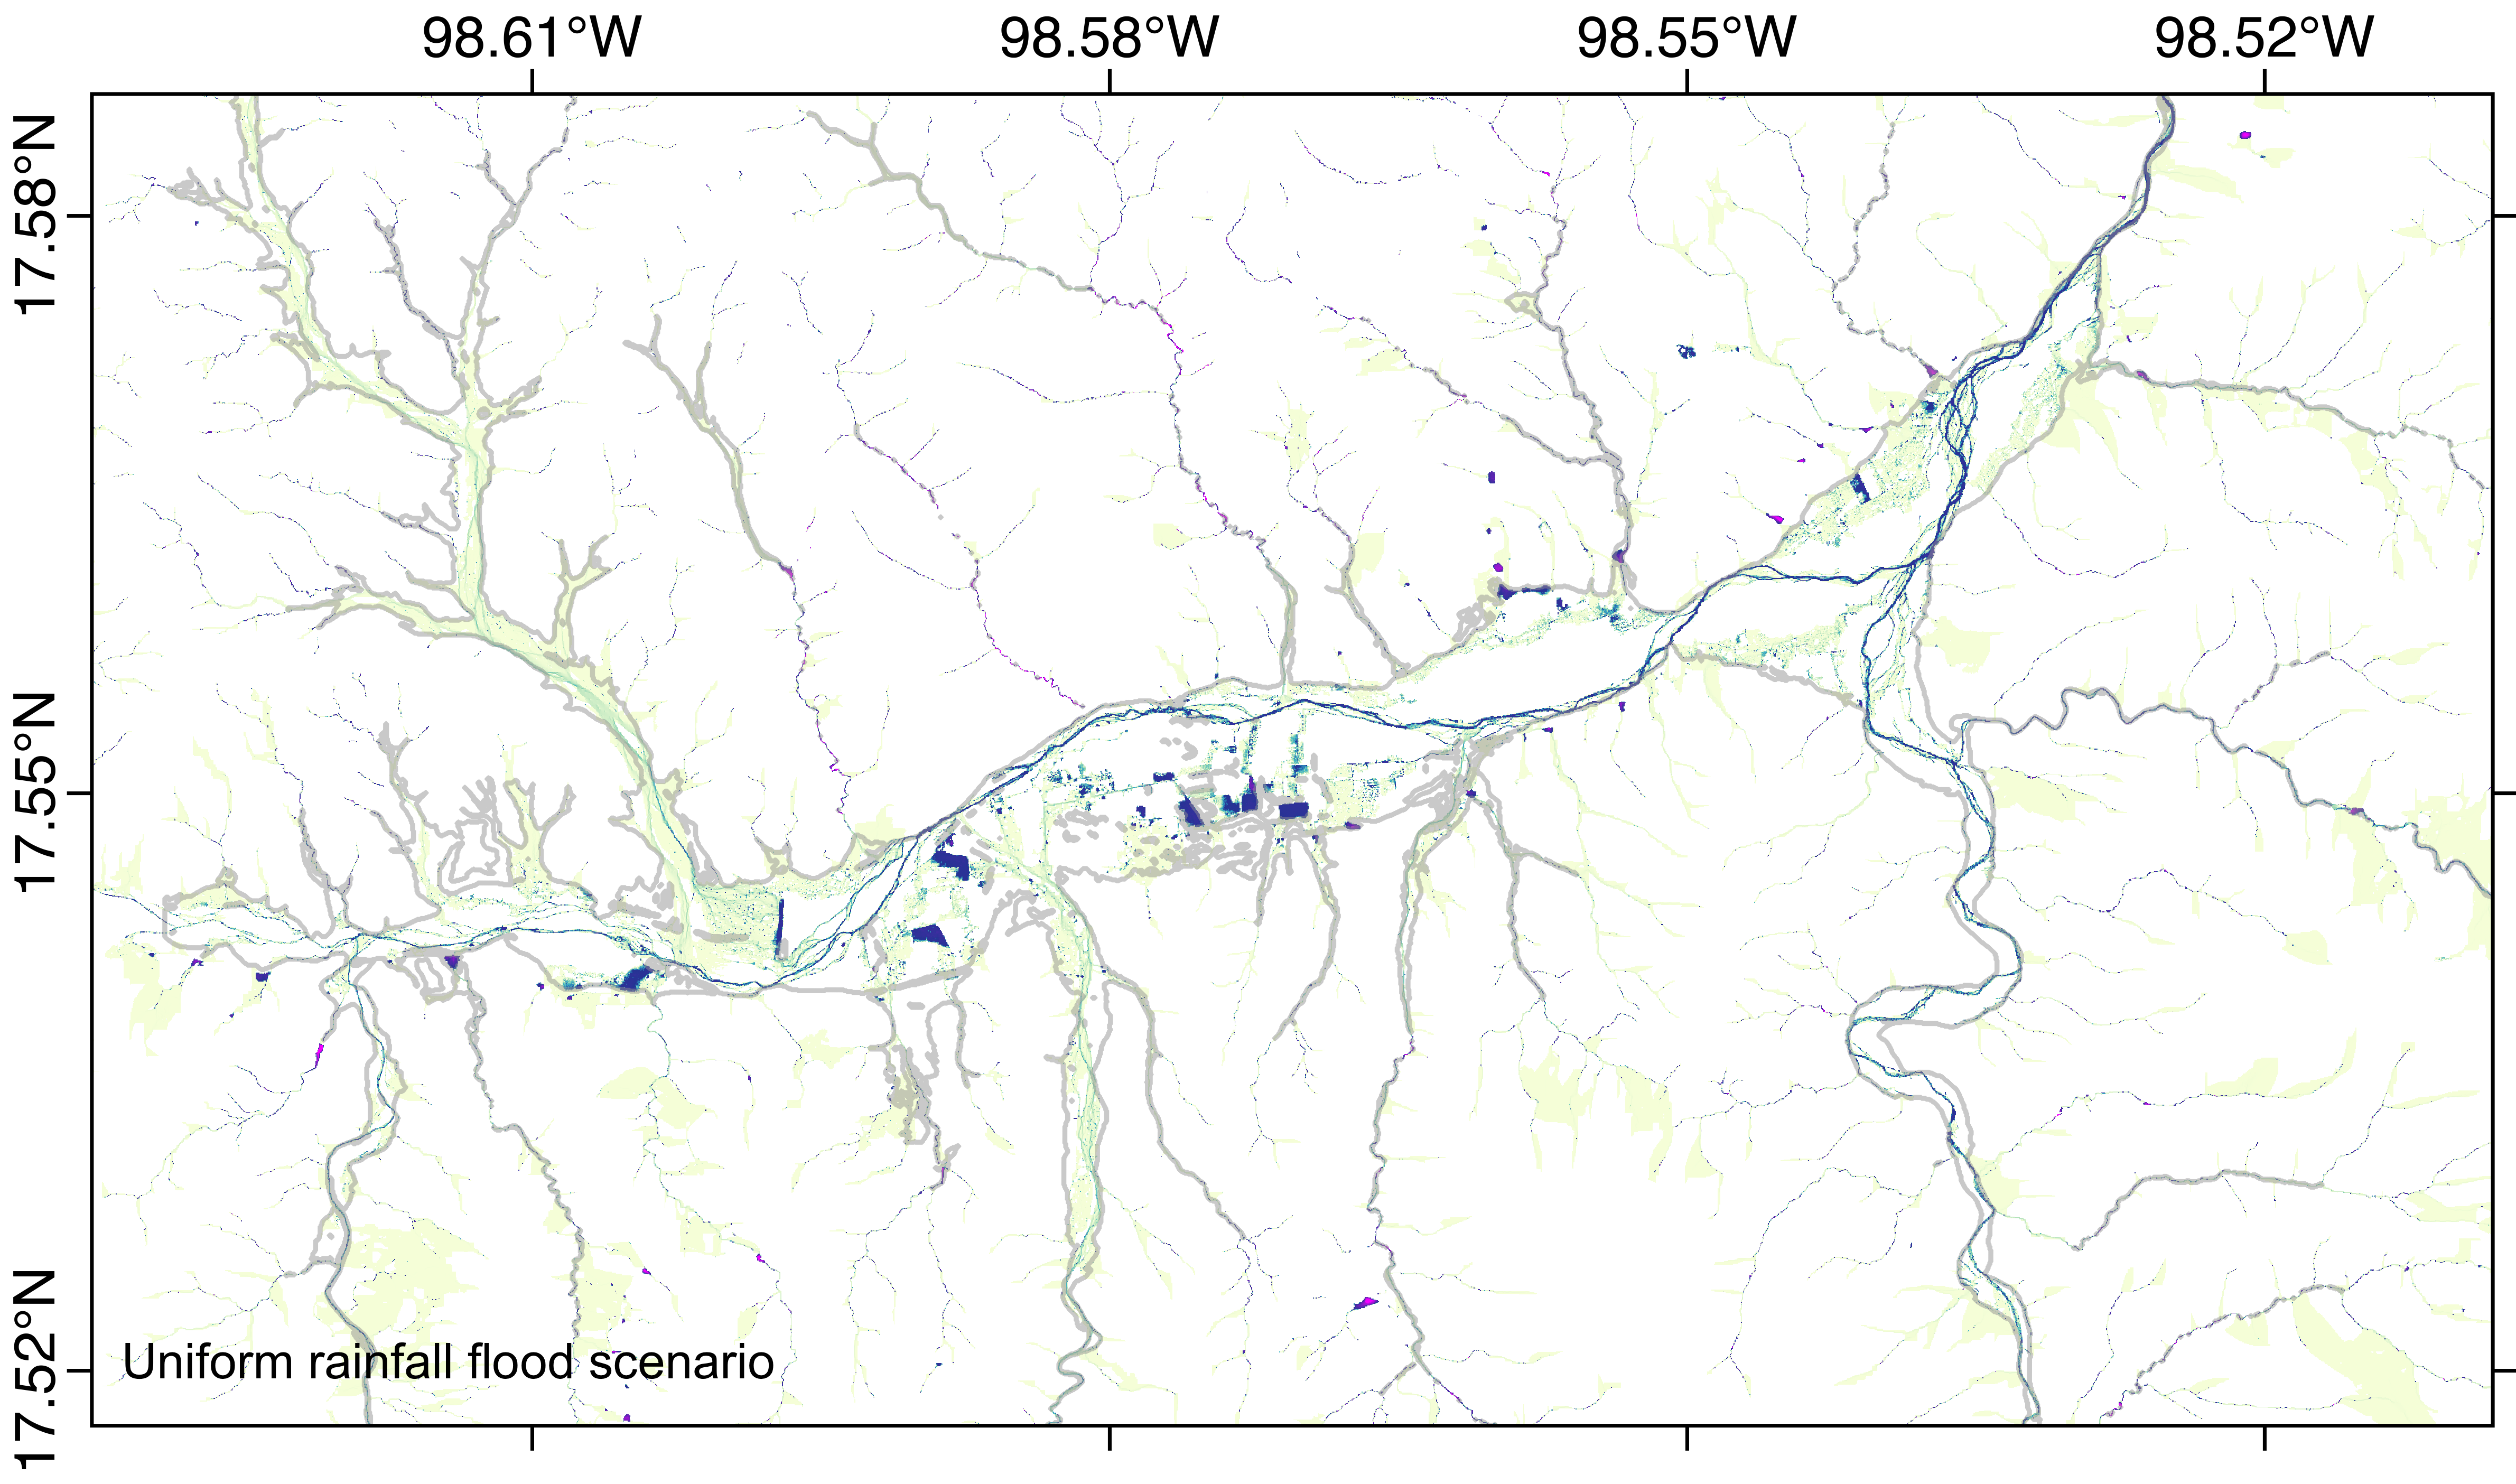
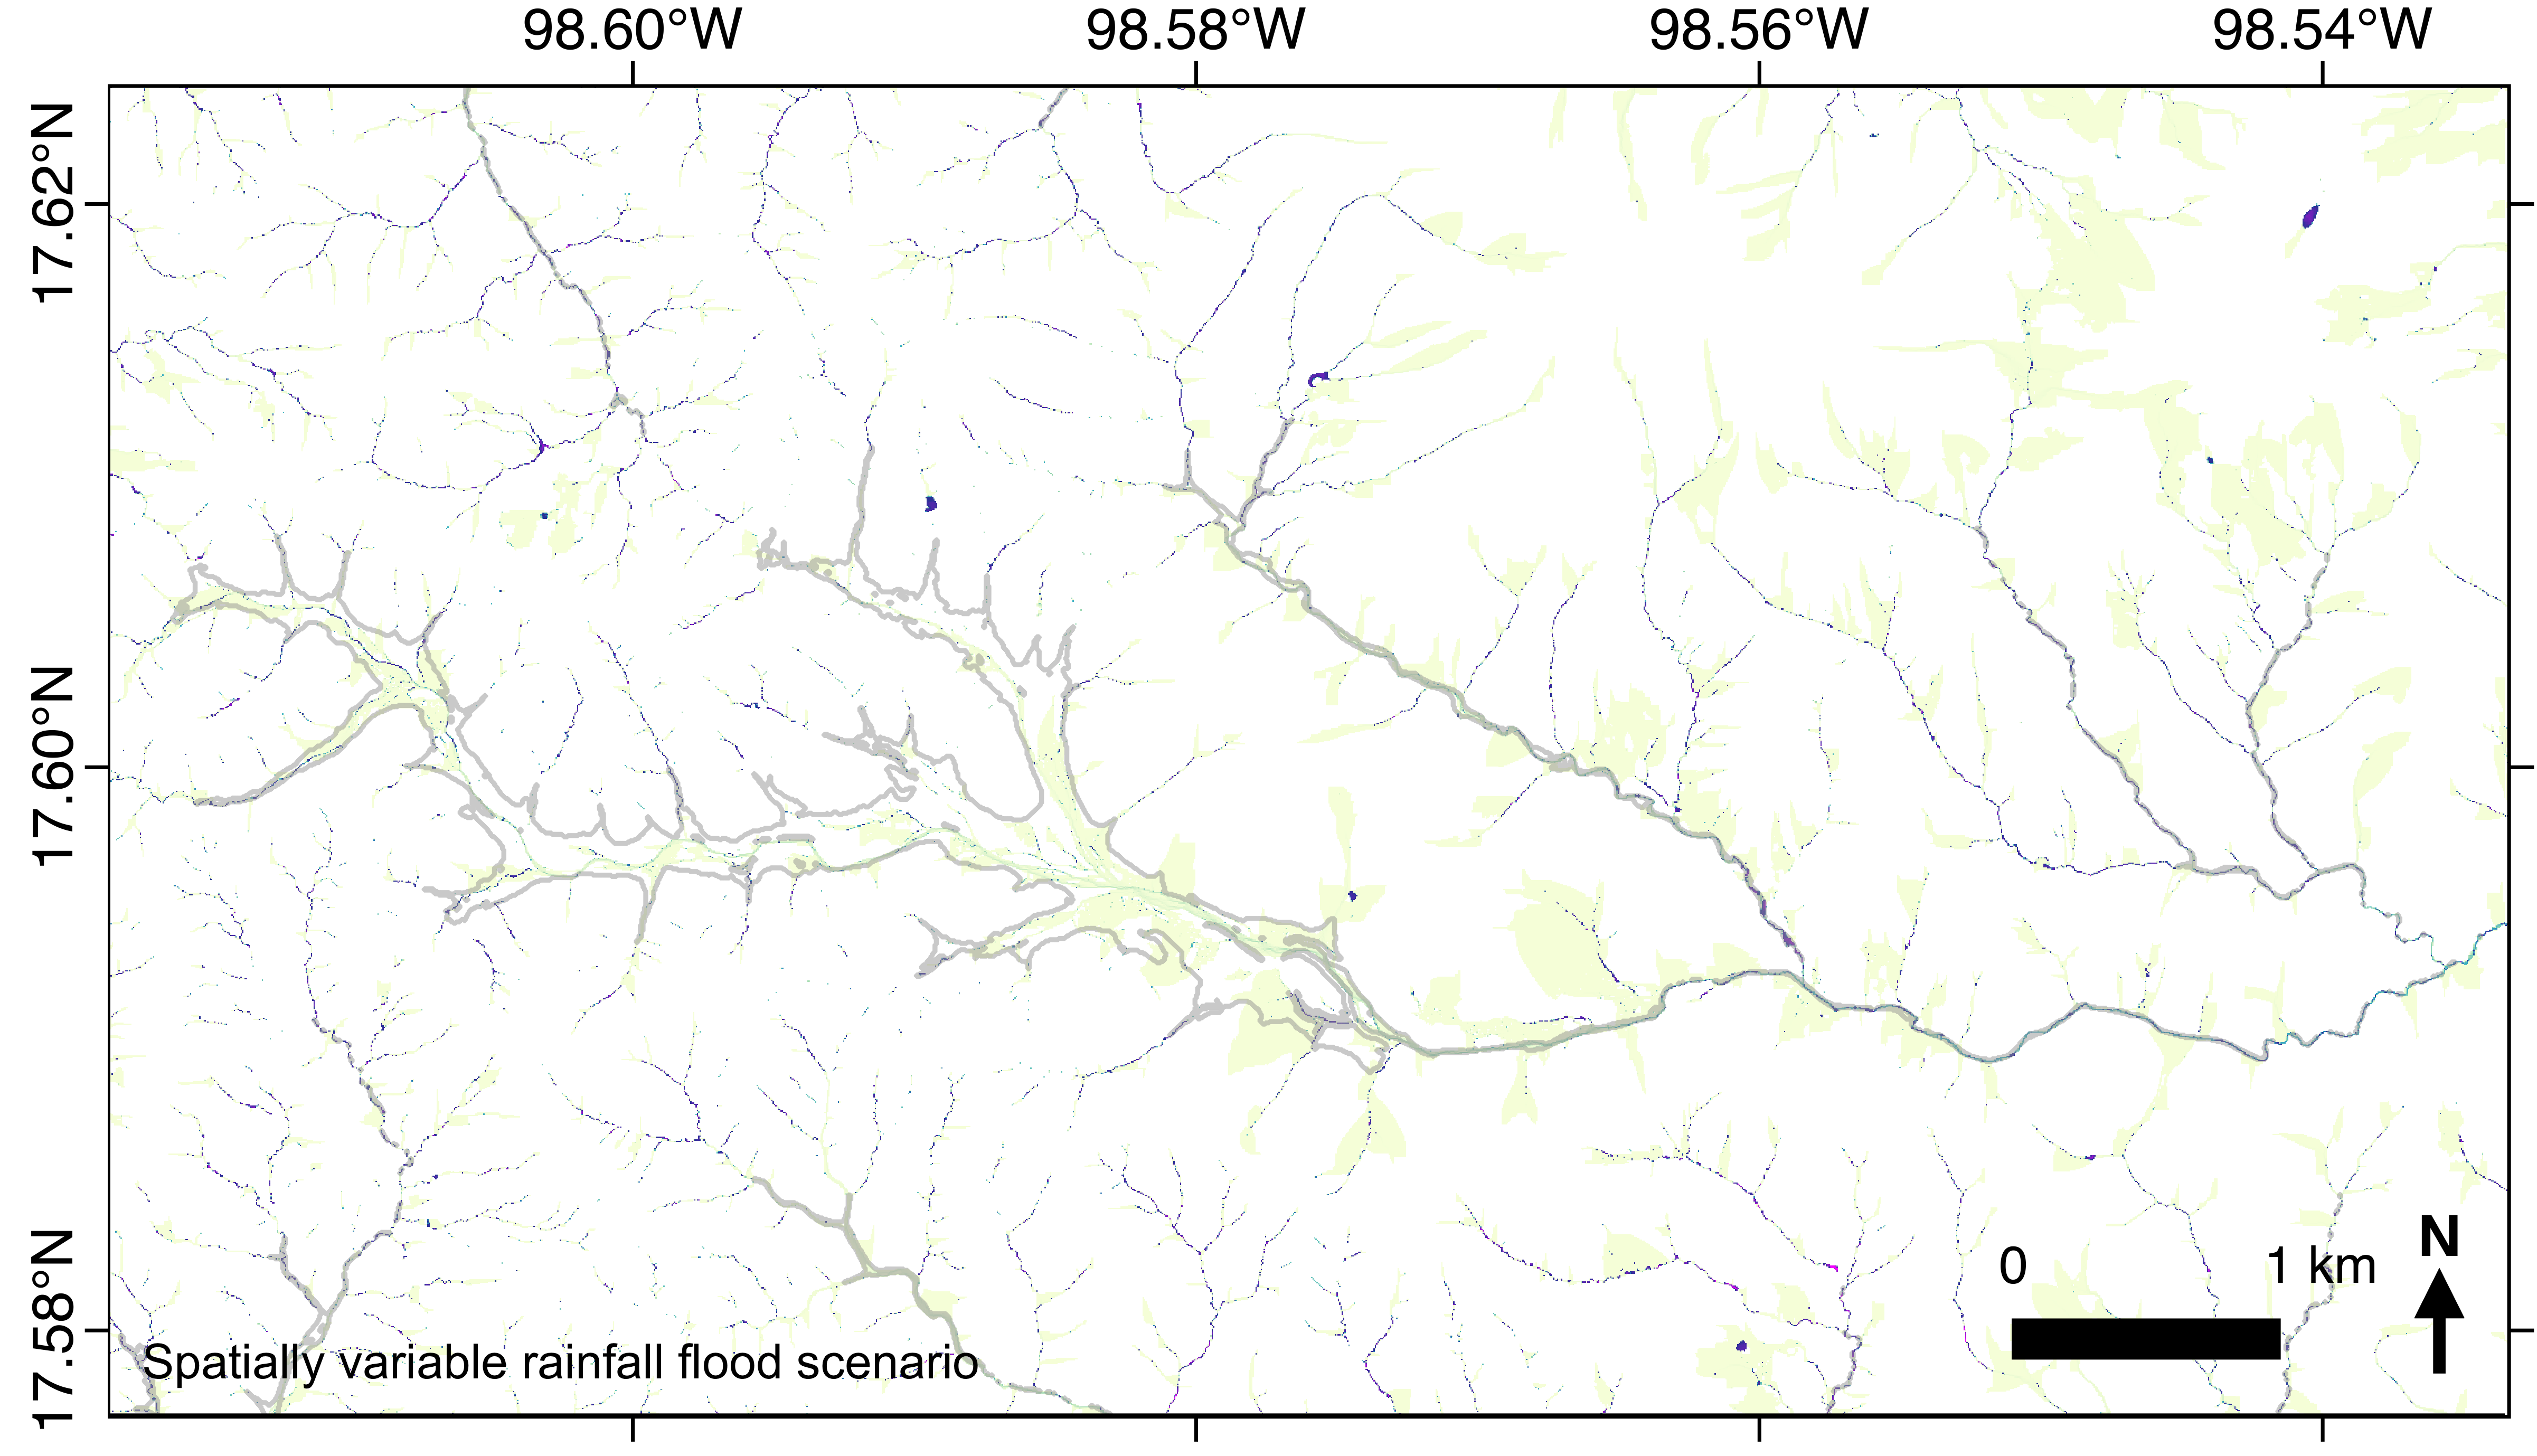
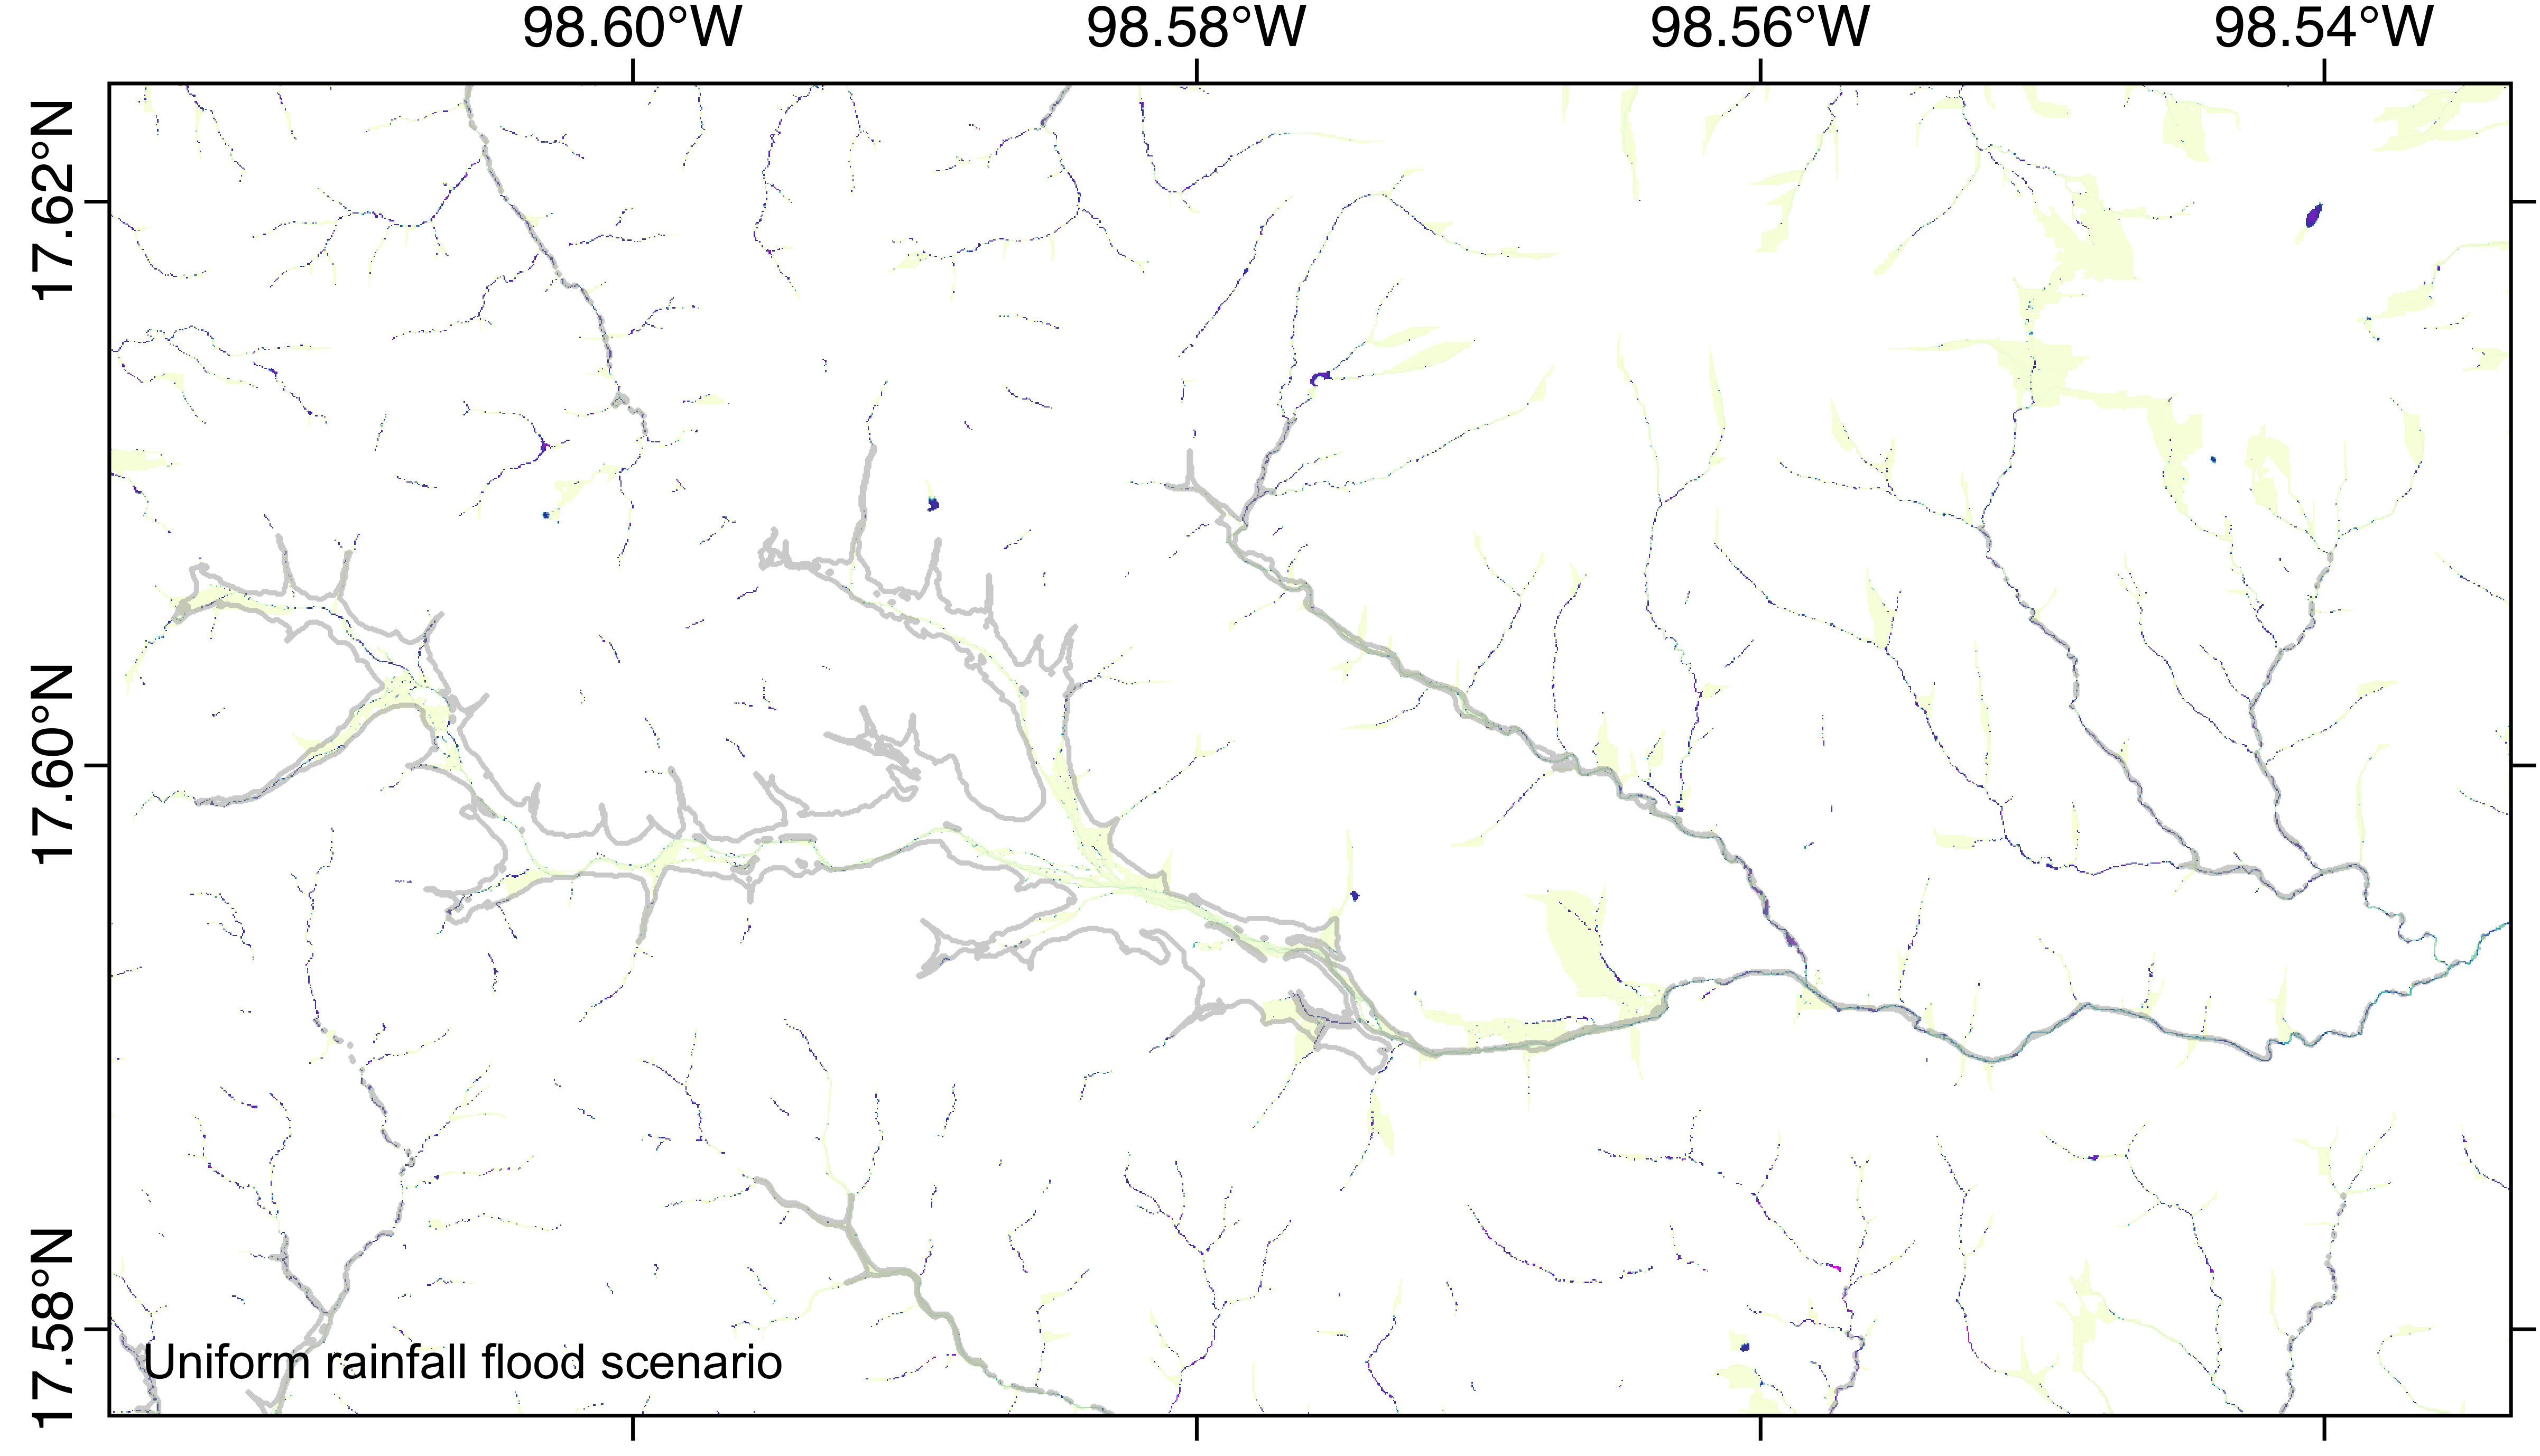
Results from the spatial intersection between the NDWI classified water body pixels (with pixel values -0.3–0 in a gradient of blues) and the pixels from the uniform rainfall (cyan) and the spatially variable rainfall (yellow) runoff scenarios. Results are focused on Floodplain 1 (left), Floodplain 2 (top right) and Floodplain 3 (bottom right)
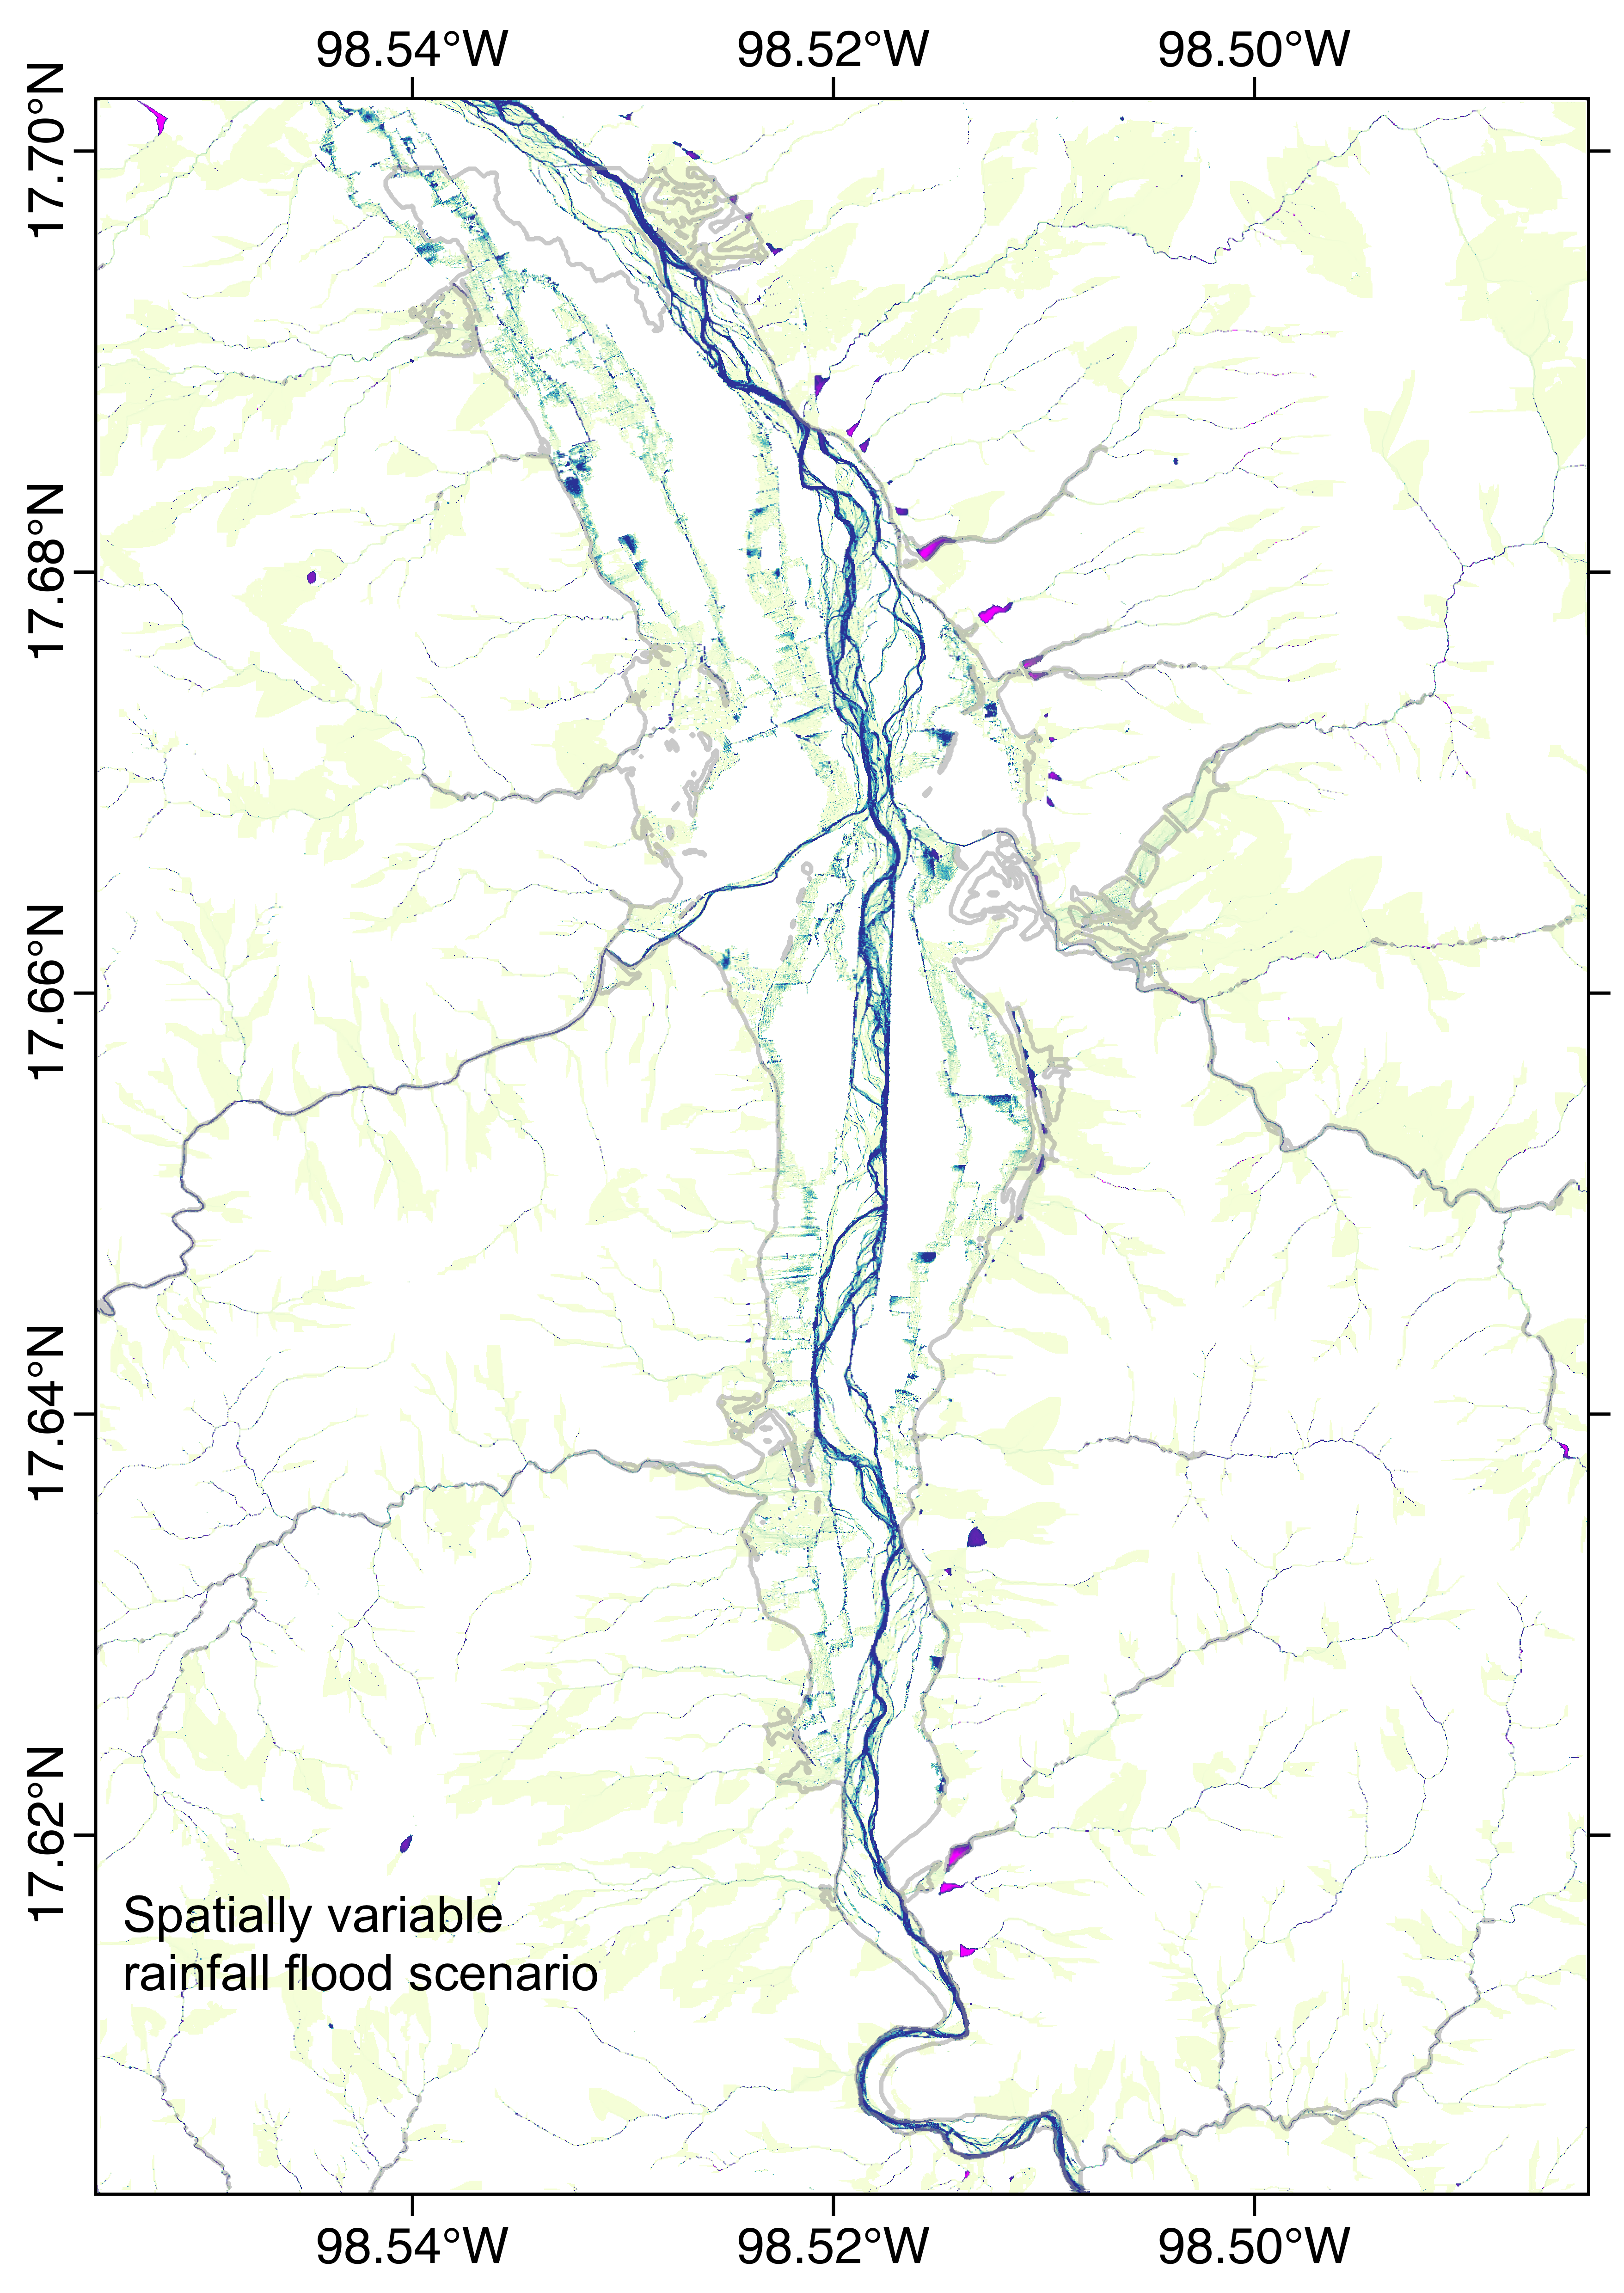
Drag the red triangle to compare the simulated floodwater runoff depths in Floodplain 1 for uniform (leftward) and spatially variable rainfall (rightward). (Click for full size)
Drag the red triangle to compare the simulated floodwater runoff depths in Floodplain 2 for uniform (leftward) and spatially variable rainfall (rightward). (Click for full size)
Drag the red triangle to compare the simulated floodwater runoff depths in Floodplain 3 for uniform (leftward) and spatially variable rainfall (rightward). (Click for full size)
Menu
Discussion
The resulting hydrographs showed a clear difference between the model's runoff response to uniform versus spatially variable input rainfall. The higher peak discharge observed in the spatially variable rainfall scenario is most likely due to the detail of the cyclonic storm direction being able to be included in the model. Singh (1997) observed a difference in catchment hydrographs depending on the direction of precipitation and direction of catchment flow, highlighting the importance of using spatially variable rainfall in this study where the Hurricane Max cyclone travelled northward along with the Tlapaneco catchment. Faster rising limbs represent runoff reaching the catchment outlet faster, suggesting the feature of lower rainfall rates falling across the north half of the catchment in the spatially variable rainfall scenario has caused a lag in the hydrograph.
Key characteristics in the floodwater runoff were also able to be observed using the water depth outputs, such as damming effects caused by bridges and roads in the built-up settlements of Tlapa de Comonfort and Alpoyeca. The very high resolution LiDAR DEM recorded these false dams and caused a pooling of simulated floodwater, highlighting regions of high risk in both cyclonic and convective rainfall events.
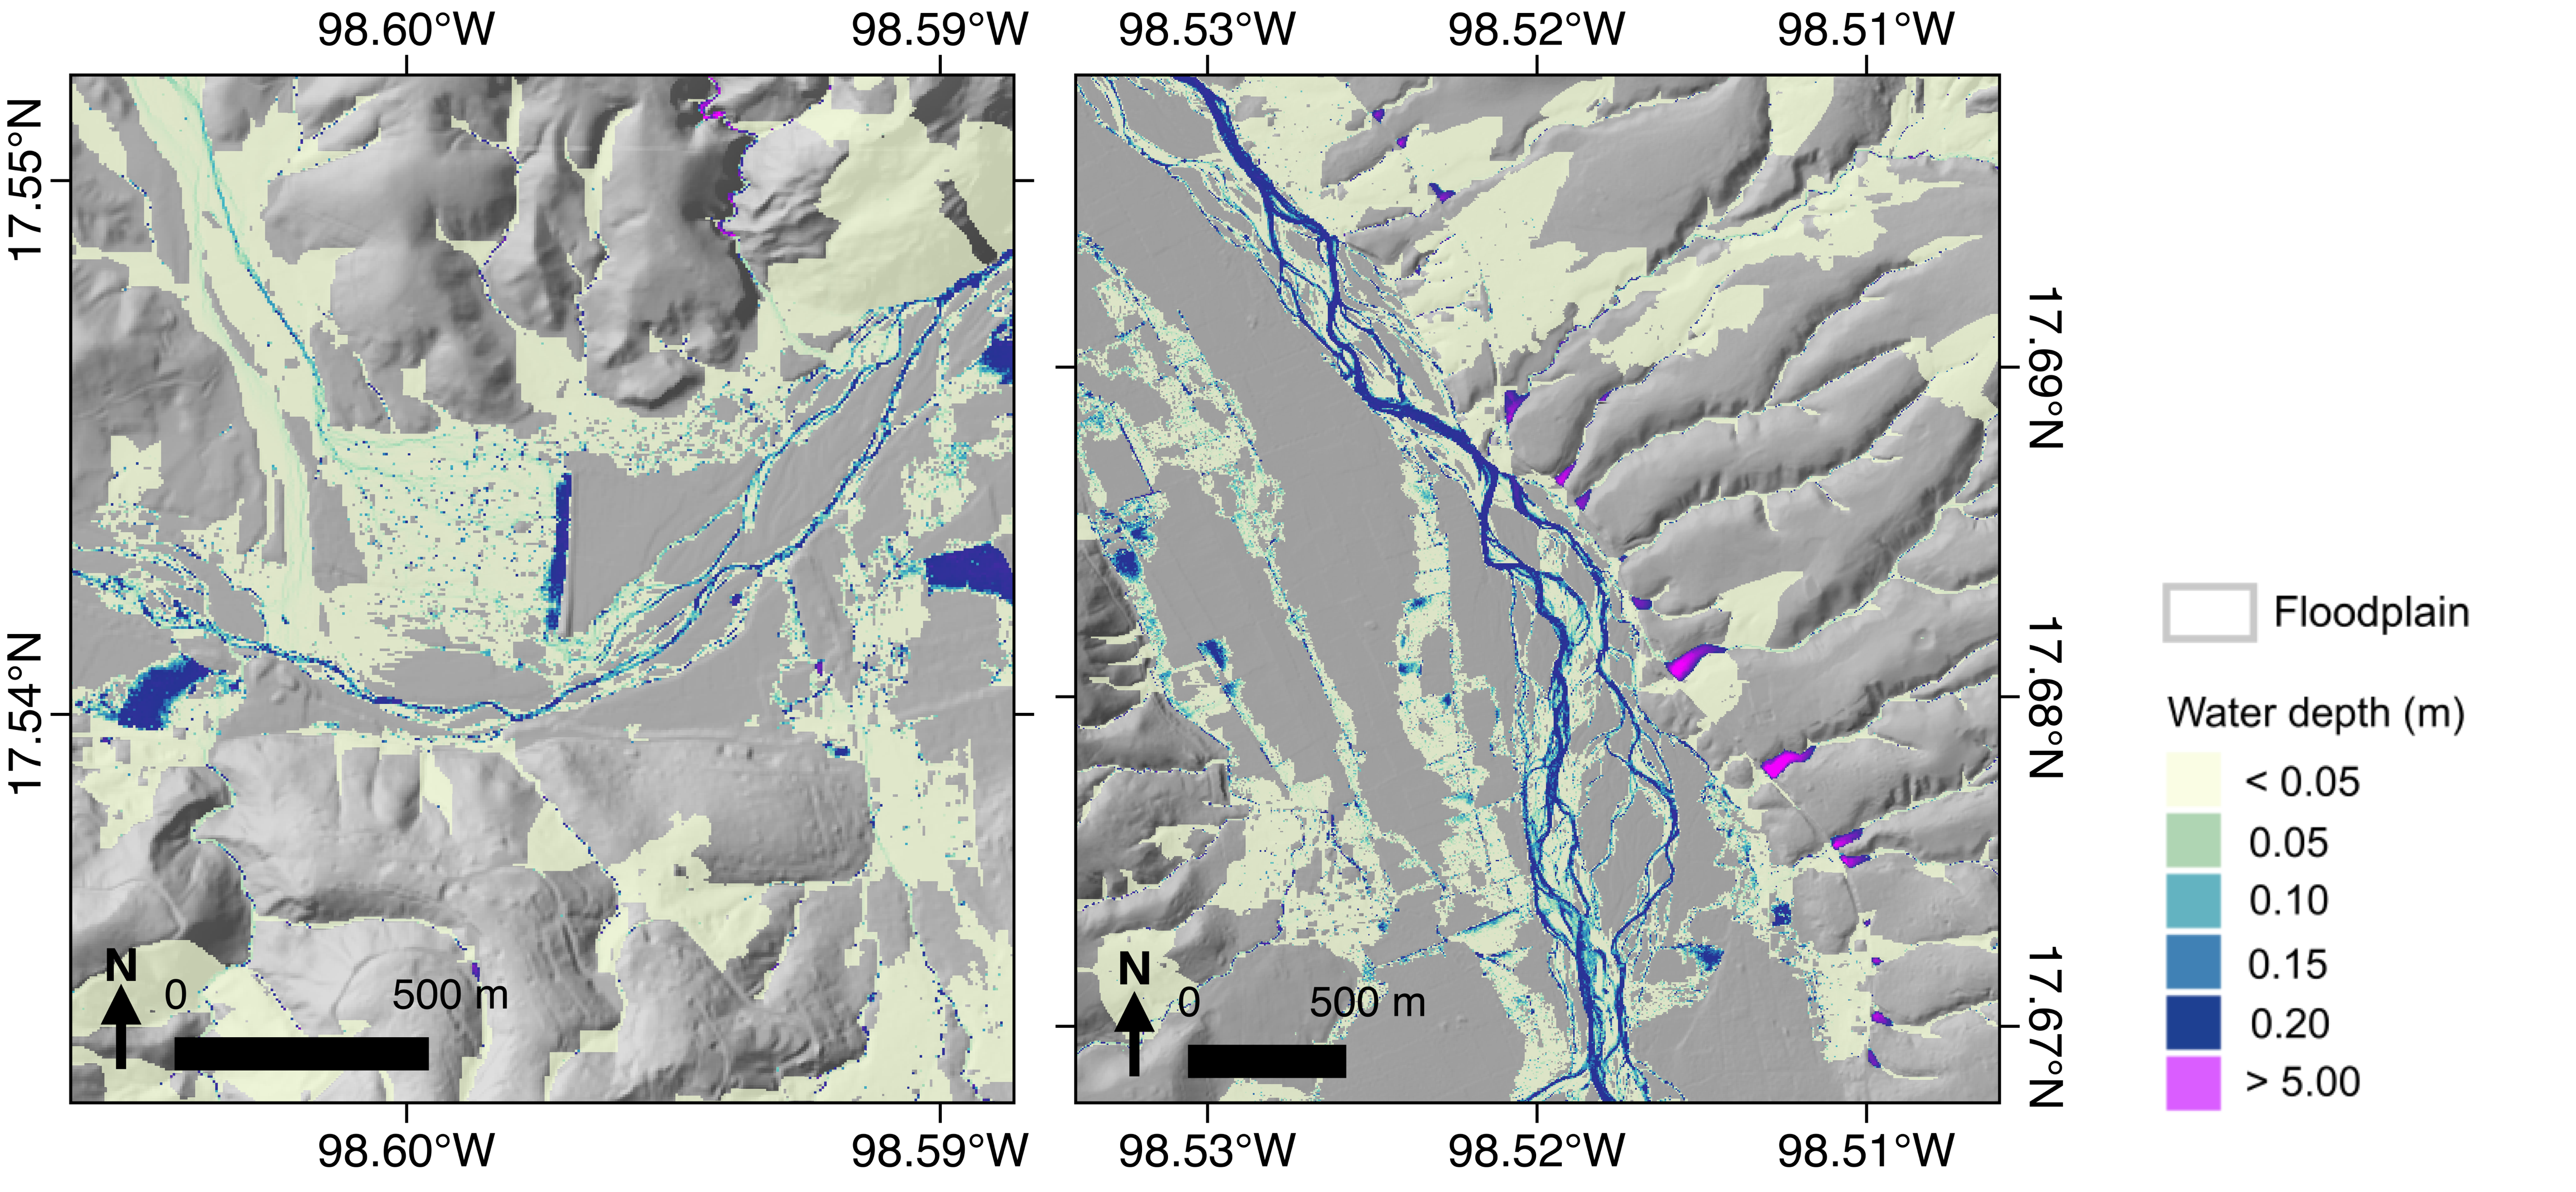
Pooling effect observed in both the spatially variable and uniform input rainfall scenarios, for a road running N-S in Tlapa de Comonfort (left) and a road cutting off alluvial fans running NW-SE in Alpoyeca (right)
Simulated runoff differences observed between uniform and spatially variable rainfall scenarios are visible in all three high-risk floodplain areas delineated. In Floodplains 1, 2 and 3, the spatially variable rainfall scenario produced greater shallow floodwater extent than uniform rainfall, most likely due to the variable patterns of higher rainfall rates across certain hillslopes and valley floors. The comparison between the extracted water body pixels using the NDWI and the simulated water pixels shows the spatially variable rainfall scenario has a higher overall number of intersecting pixels, suggesting it is the closer of the two scenarios to real data from the event.
Table of results from real NDWI and simulated floodwater cell intersections
| Input rainfall scenario | Raster timestep | Intersecting | Not intersecting | ||
|---|---|---|---|---|---|
| Cell count | Area (sqkm) | Cell count | Area (sqkm) | ||
| Uniform | 9600 | 150659 | 3.77 | 14928733 | 373.22 |
| Spatially variable | 9600 | 154087 | 3.85 | 14925305 | 373.13 |
Menu
Conclusions
While the differences between simulated runoff for the uniform and spatially variable rainfall scenarios were less distinct than expected, the study identified fields where the spatial resolution of input rainfall has the strongest influence.
The study also achieved in executing a novel methodology for ratifying flood model outputs using solely remotely sensed data, highlighting regions of further development for flood modelling techniques in Central America.
If a higher spatiotemporal resolution of global rainfall rate measurements and higher quality of multispectral imagery directly following cyclone events can be achieved in the future, the fields of simplistic cellular automaton modelling and objective floodplain delineation will be able to take futher steps towards a balance between simplicity and realism in abstracting Earth surface processes.
MenuKey References
Arreguín-Cortés, F. & Cervantes-Jaimes, C., 2017. Flood Risk Management in Mexico. In: T. I. Hromadka, ed. Flood Risk Management. s.l.:IntechOpen, p. 227.
Clubb, F. et al., 2017. Geomorphometric delineation of floodplains and terraces from objectively defined topographic thresholds. Earth Surface Dynamics, Volume 5, pp. 369-385
Coulthard, T. et al., 2013. Integrating the LISFLOOD-FP 2D hydrodynamic model with the CAESAR model: implications for modelling landscape evolution. Earth Surface Processes and Landforms, 38(15), pp. 1897-1906.
Du, Y. et al., 2016. Water Bodies’ Mapping from Sentinel-2 Imagery with Modified Normalized Difference Water Index at 10-m Spatial Resolution Produced by Sharpening the SWIR Band. Remote Sensing, 8(4), p. 354.
Singh, V., 1997. Effect of spatial and temporal variability in rainfall and watershed characteristics on stream flow hydrograph. Hydrological Processes, 11(12), pp. 1649-1669.
Valters, D., 2017. Modelling catchment sensitivity to rainfall resolution and erosional parameterisation in simulations of flash floods in the UK, Doctoral dissertation: University of Manchester.
MenuExternal Links
| To learn more about objective floodplain delineation and other automated landscape analyses: | To learn more about running a hydrodynamic model and current cellular automaton flood modelling efforts: | For more information about GIS at the University of Edinburgh: |
Menu