|
Regional Scale Volcanic Hazard Mapping in Guatemala |
|||||
|
Jonathan Paul Collin |
|||||
Context
Volcanic
hazards maps are recognised as a crucial tool in communicating risk between
scientists, government institutions and vulnerable communities. This risk is
composed of hazard, exposure and vulnerability; all of which contribute to
risk mitigation recommendations. Society is in need of a systematic approach
to estimate and compare environmental and anthropogenic impacts that affect
large geographic areas. Conventionally, volcanic hazard maps are created at a
local scale, with a single volcano under assessment; however, this study will
aim to develop a regional scale volcanic hazard map for the Central American
country of Guatemala. Seven volcanoes were chosen based on the availability
of data regarding past eruptions and include Tacana,
Santa Maria, Almolonga, Atitlan, Fuego, Acatenango and Pacaya. Four
volcanic hazards were identified to cause to greatest wide ranging impacts in
Guatemala, which include tephra fallout, lahars, lava flows and sector
collapses. Valuable hazard extent data was provided by INSIVUMEH and
therefore some volcanoes did not need new assessments for lava flow and
sector collapse hazards. |
|||||
Methods
Determining
Individual Hazard Extent Tephra Fallout TephraProb is the toolbox of
choice within this study, which uses Matlab
functions and the TEPHRA2 model to create
scenario-based probabilistic hazard assessments for ground tephra
accumulation. The program allows for automatic download of NOAA (National Oceanic
and Atmospheric Administration) wind data, analysis of this wind data, direct
access to GVP (Global Volcanism Program) data and integrated use of the
TEPHRA2 model. From wind analysis and knowledge regarding VEIs (Volcanic Explosivity Index), scenarios were developed to simulate
tephra dispersal following a 10 km, 15 km and 20 km eruption column, within
both the dry (November to April) and wet (May to October) season.
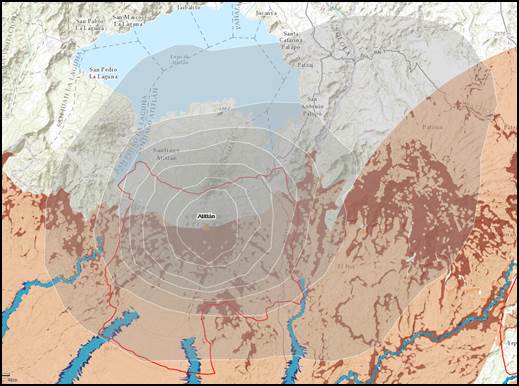
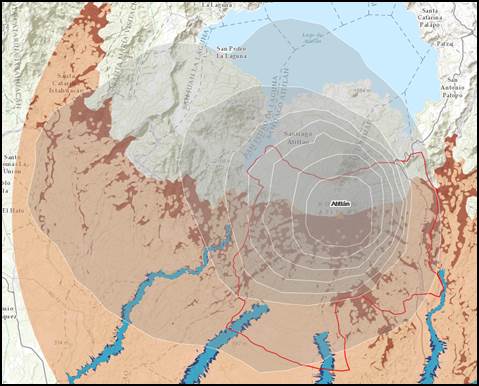
Left: Atitlan tephra dispersal
following an eruption with a 15 km eruption column in the dry season. Right: Atitlan tephra dispersal
following an eruption with a 15 km eruption column in the wet season.
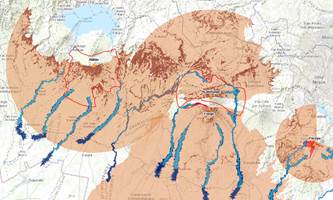
The USGS LAHARZ program is the model
of choice that automatically maps the probable lahar hazard zones during or
after a volcanic event. The tool box can be added into ArcMap, where DEM data
is required as an input of the program, along with lahar volumes to provide
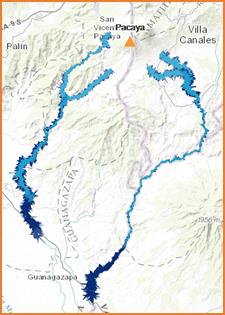
an automated map of potential lahar inundation. Two input volumes
of water were used to create scenarios of lahar hazards following an
eruption, during a period of high rainfall intensity. Lava Flow Lava flow hazard
assessment is only required for two volcanoes, Atitlan and Acatenango. Data for past lava flows at Atitlan and Acatenango does not exist and therefore literature was
consulted to determine a lava flow hazard zone. A report by USGS stated that
lava flow hazards at Atitlan volcano have not travelled more than 7 km from
the vent source and no more than 10 km at
Acatenango. Above: Pacaya volcano lahar hazards with an input of 10
million (Light blue) and 30 million (Dark blue) cubic metres of water. Sector Collapse Atitlan, Acatenango and Fuego all required sector collapse hazard
assessment. Literature was a valuable source in composing a useful method.
Literature revealed that debris avalanches generated by sector collapses
would not typically travel more than 30 km at Atitlan, 25 km at Acatenango and 50 km at Fuego. For dry materials, the
angle of response can lie between 30 and 45 degrees, however the input of
water can increase this angle due to the surface tension between water and
the material. Therefore the slope angle highlighted within this study is set
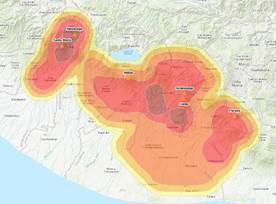
at 30 degrees +, acting as a lower boundary for identifying steep slopes. Regional Volcanic
Hazard Risk With all volcanic
hazard determined for each volcano under study, thought is now made into the
way in which these hazards can be amalgamated to show regional scale
visualisation. Areal
interpolation is the method used for the process of estimating values of one
or more variables in a set of target polygons. This method was used to
interpolate hazard extent polygons, to produce a continuous output that
represents hazard risk.
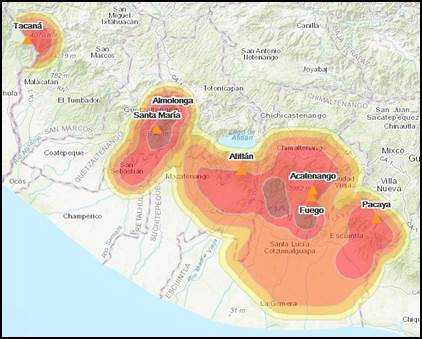
Above: Final output of a regional volcanic hazard risk
zone |
|||||
VulViz
VulViz is an interactive
mapping tool used to display volcanic hazards at various scales in
Guatemala. This tool was developed because of the need to better understand
volcanic hazards at various scales. A greater understanding ultimately leads
to enhanced hazard mitigation strategies and more importantly can save lives.
By searching through this tool, it is possible to visualise these hazards at
a regional scale and at a local scale. |
Click logo to visit interactive mapping tool |
||||
Discussion
This study
initiates discussion into the idea of regional scale volcanic hazard mapping.
As this subject is in its primary stages of development, this project hopes
to spark discussion and provide an example of what can be achieved when
moving away from the conventional, local scale volcanic hazard map. A wide
variety of methods are currently used in generating hazard maps and it is
important to acknowledge that one model cannot fit all situations. Methods
for producing a regional scale volcanic multi-hazard map do not currently
exist. It was therefore initially challenging to develop a new method, that
would be both simple to implement, considering the time constraints, yet
scientific in its approach. The areal interpolation method used within this
project is innovative in its use for this subject and successfully produced a
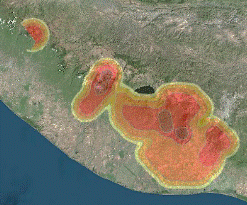
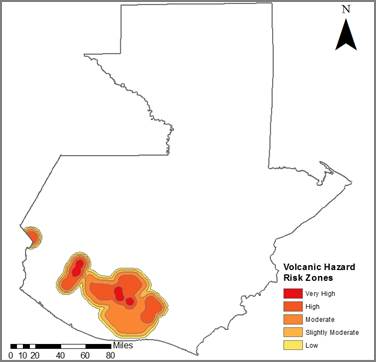
continuous surface of volcanic hazard risk. The figure below displays the
resulting layer of areal interpolation and indicates 5 areas of risk
severity. The highest risk is located around the vents of Almolonga
and Santa Maria, due to the very large population living within 10 km of the
volcanoes and also the high VEI 6 figure for Santa Maria as designated by the
Global Volcanism Program. The areas to the south and east of Fuego are also
designated high risk due to the numerous hazards that combine and overlap within
these areas, from hazards generated by Atitlan and Acatenango.
Tacana experiences no very high risk due to the low
population living within 10 km. It is clear to see that the interpolated
layer successfully manoeuvres the extent of the hazards, while incorporating
the element of risk through population and VEI.
Above:
Regional scale volcanic risk zone layer |
|||||
Final
Thoughts
An effective
hazard map is quantitative, accountable and defendable. VulViz
is therefore defined as effective. It is quantitative through its involvement
of four different volcanic hazards at seven volcanoes, at both regional and
local scale; accountable through its clear discussion of model simulation
uncertainty and limitations; and defendable through its clear justification
of every decision made. |
|||||