
Routing Subsea Cables
for Scottish Offshore Renewable Search Areas
Ingrid Iredale
(MSc Dissertation)
Introduction Methods Results Discussion and References
Introduction
Methods
A multicriteria decision analysis matrix (Malczewski, 1999) was used to apply weights to ecological variables and create a cost surface model using ArcGIS. UK Biodiversity Action Plan Habitats and man-made obstructions were buffered and made into partial or full masks along with Marine Protected Areas, to be incorporated into the cost surface. From this, cost distance rasters were created and used to define cost paths.Results
| Habitat Code | Habitat Description | Weights |
|---|---|---|
| A3.1 | Atlantic and Mediterranean high energy infralittoral rock | 0.021577176 |
| A3.2 | Atlantic and Mediterranean moderate energy infralittoral rock | 0.033068758 |
| A3.31 | Silted kelp on low energy infralittoral rock with full salinity | 0.067349292 |
| A4.11 or A4.13 | Very tide-swept faunal communities on circalittoral rock or Mixed faunal turf communities of circalittoral rock | 0.048866411 |
| A4.12 | Sponge communities on deep circalittoral rock | 0.090953842 |
| A4.27 | Faunal communities on deep moderate energy circalittoral rock | 0.123206361 |
| A4.2 | Atlantic and Mediterranean moderate energy circalittoral rock | 0.090953842 |
| A4.31 | Brachiopod and ascidian communities of circalittoral rock | 0.123206361 |
| A4.33 | Faunal communities on deep low energy circalittoral rock | 0.164757068 |
| A5.13 | Infralittoral coarse sediment | 0.00996192 |
| A5.14 | Circalittoral coarse sediment | 0.00996192 |
| A5.15 | Deep circalittoral coarse sediment | 0.00996192 |
| A5.23 or A5.24 | Infralittoral fine sand or Infralittoral muddy sand | 0.021675235 |
| A5.25 or A5.26 | Circalittoral fine sand or Circalittoral muddy sand | 0.021675235 |
| A5.27 | Deep circalittoral sand | 0.021675235 |
| A5.33 or A5.34 | Infralittoral sandy mud or Infralittoral fine mud | 0.033040741 |
| A5.35 or A5.36 | Circalittoral sandy mud or Circalittoral fine mud | 0.033040741 |
| A5.37 | Deep circalittoral mud | 0.033040741 |
| A5.43 | Infralittoral mixed sediments | 0.014009068 |
| A5.44 | Circalittoral mixed sediments | 0.014009068 |
| A5.45 | Deep circalittoral mixed sediments | 0.014009068 |
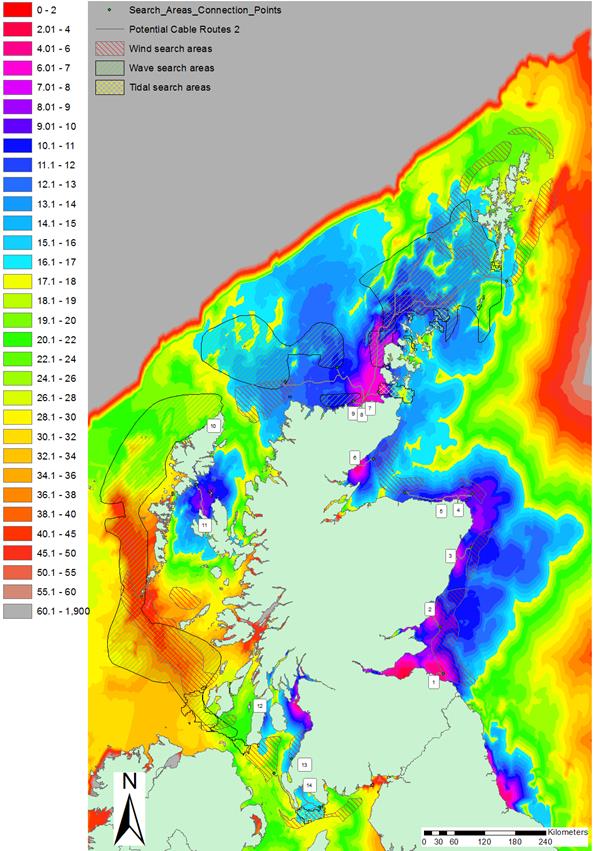
Figure 1. Cost Distance Map with Suggested Subsea Cable Routes. Information contained in this model has been derived from several sources: Scottish Natural Heritage, 2012; Crown Copyright/SeaZone Solutions Ltd, 2014; Crown Copyright/Marine Scotland, 2014; the National Grid, 2013; and the EUSeaMap Consortium webGIS data (jncc.defra.gov.uk/page-5040), which is made available under the pilot project for European Marine Observation Data Network (EMODnet), funded by the European Commission's Directorate- General for Maritime Affairs and Fisheries (DG Mare). All rights reserved. Not to be used for navigation.
Discussion
A follow-on study could examine this subject further, developing the model to investigate the relationship between distance and the cost surface. An interactive user-interface to select weights and make the process more transparent, would also be useful.
References
Jay S (2011). Mobilising for marine wind energy in the UK. Energy Policy, 39: 4125-4133Kern F, Smith A, Shaw C, Raven R and Verhees B (2014). From laggard to leader: Explaining offshore wind developments in the UK. Energy Policy, 69: 635-646
Malczewski J (1999). GIS and multicriteria decision analysis. John Wiley and Sons Limited, Canada
The Scottish Government (2013). Planning Scotland’s Seas: Scotland's National Marine Plan (Consultation Draft). www.scotland.gov.uk/Publications/2013/07/9185