|
|
||||||
|
Exploring the
quality of crowd sourced data |
||||||
|
Miles MacCalman |
||||||
ContextIn the past, only formal data sources were available for spatial analysis. Whilst the quality of this formal data was high, there were limitations in its use and application due to costs and licencing restrictions. Some ‘open’ formal data has become available for all to use for free under government initiatives, but the majority of formal data still has very clearly defined, restrictive and potentially costly licencing agreements. Many users of geographic data have sought to find a ‘work around’ or other options to avoid these restrictions. As a result there has been a massive growth in the development of, contribution to and use of informal data sources in the last decade. The rise of informal data sources or Volunteered Geographic Information (VGI) (Goodchild, 2007) has been phenomenal. There is now a range of web based projects, such as OpenStreetMap (OSM) (OpenStreetMap, 2014) and Wikimapia (Wikimapia, 2014) that allow user communities to create, manage and share geographic datasets all with little or no cost to subsequent users. However, the quality and completeness of polygonal features within OpenStreetMap (OSM) still remains to be investigated, measured and quantified. As such, this research looks to analyse the data quality of the informal (OSM) polygonal data against a reference polygonal dataset from Ordnance Survey (OS). To achieve this goal, the research looked at schools, as they play a significant part of public life. By focusing on school data (as a manageable subset) it gives a useful indicator to illustrate the wider quality of polygonal data in OSM. Methodology and datasetsDue to the range of the data and research undertaken, the analysis has been separated into four clear areas of activity each using a relevant methodology (Figure 1).
Figure 1 –
Methodologies and outputs For this research project, formal data was gathered from
local council authorities, the Scottish Government (SG) and the national
mapping agency, Ordnance Survey (OS). The quality of informal data is known
to vary according to positional accuracy, attribute accuracy and geographic
region (urban v’s rural). Therefore, three local council authority areas
within Scotland were used as case study areas. The aim was to complete a
comparison between study areas across a range of different geographic
locations and authority sizes. These were the City of Edinburgh Council (CEC)
an urban city authority, Perth and Kinross Council (PKC), a rural authority which
includes the city of Perth and finally the Scottish Borders Council (SBC)
covering a mainly rural landscape with a number of medium sized towns (Figure
2).
Figure 2 – Local
council case study areas Key resultsMethodology 1 – geocoded postcodes cannot be relied upon to pin-point specific entities such as schools (Figure 3).
Figure 3: Distance of
over 2km between geocoded postcode and actual school (maximum distance found) Methodology 2 – It should not be assumed that an OS reference dataset is complete (Figure 4).
Figure 4: Panmure St
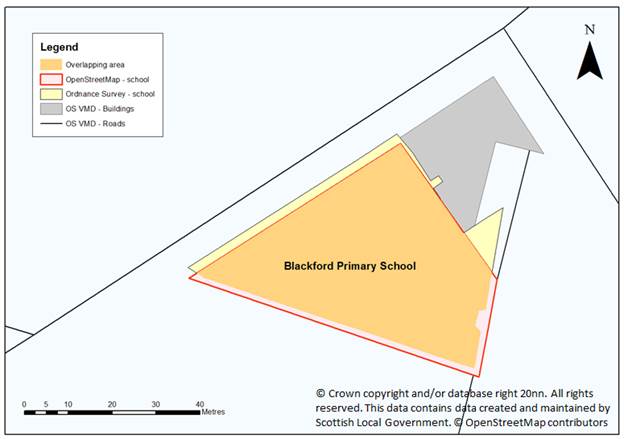
Ann’s school does not appear on the OS dataset Methodology 3 – Polygonal overlap between OSM and the OS reference dataset varies greatly, but is higher in rural areas (Figure 5 and Figure 6).
Figure 5: 90% overlap
between OS and OSM datasets
Figure 6: 40% overlap
between OS and OSM datasets Methodology 4 – OSM attribution is very patchy and incomplete. It seems that OSM contributors like to draw objects but are not interested/don’t understand the benefits of good attribution. Interpretation of results
With methodology 1, we looked at council data against Scottish Government (SG) data. What was clear was that while the SG data was very up-to-date, the geocoding of the postcodes had limited value other than giving a general point in the general vicinity of where a school was located. It also highlighted that while councils have very accurate data, it seemed that there is no regular schedule for data review (as the Scottish Government has) and as a result old and new schools can be missing from the relevant datasets. In methodology 2, we investigated the quality and completeness of the reference dataset provided by OS. It was proven to be very high, but not 100% complete. Issues flagged were mostly of a temporal nature and occurred in the local council data as well as the OS reference dataset. Methodology 3 compared OpenStreetMap (OSM) and Ordnance Survey (OS) polygonal data. It was clear from the outset that the OSM dataset was incomplete compared to the OS reference dataset. However, it was interesting to see how the data compared across the different urban and rural areas. There was a greater polygon overlap/accuracy in rural areas than in urban areas. As such it can no longer be assumed that a greater number of contributors focused on urban area will create the most accurate data. It comes down to the enthusiasm of the individual contributors, patience and/or local knowledge which makes them very thorough in the mapping activities that they complete. In Methodology 4 there was an examination of the attribution options and quality across the formal and informal datasets. The lack of attribution across the OSM polygonal data significantly weakened the overall effectiveness of the data gathered and as a result, limits how it could be used. ConclusionsThe aim of this research was to investigate the quality
and completeness of the spatial data for schools across three case study areas
in Scotland. It examined and compared different point and polygon datasets
from a range of sources (local councils, the Scottish Government, OS and OSM)
to ascertain what levels of accuracy and completeness existed and to measure
VGI’s fitness for use. The results showed that the OSM polygonal data investigated, does not have sufficient geometric completeness or accuracy to be used instead of the OS reference dataset. In addition, the OSM attribution on the polygons (that were examined) was very incomplete and as a result further weakened the opportunities for it use in spatial analysis applications. Having completed this polygonal based research and comparing and contrasting it to previous linear research (Haklay, 2010), it has become clear that measuring the ‘fitness for use’ of OSM data needs to be considered on a feature by feature basis (Table 1). Table 1: OSM
feature types, their level maturity and fitness for use
ReferencesGOODCHILD, M.F. 2007. Citizens as voluntary sensors:
Spatial data infrastructure in the world of web 2.0. Int. J. Spat. Data Infrastr. Res., 2, 24–32. HAKLAY, M.
2010. How good is volunteered geographical information? A comparative study
of OpenStreetMap and Ordnance Survey datasets. Environment and Planning B-Planning &
Design, 37, 682-703. OPENSTREETMAP. 2014. OpenStreetMap. [ONLINE] Available at: http://www.openstreetmap.org/. [Accessed 30 July 2014]. WIKIMAPIA. 2014. Wikimapia - Let's describe the whole
world!. [ONLINE] Available at: http://wikimapia.org/. [Accessed 30 July 2014]. |