|
|
|||||||||||||
|
GIS-based Energy Consumption Mapping |
|||||||||||||
|
Estimating energy savings for the
residential building stock at urban scale |
|||||||||||||
|
Chrysi Balta MSc Geographical Information Science |
|||||||||||||
|
Climate
change is a growing issue globally,
with housing energy consumption at city level being a major contributor of CO2 emissions. According
to the European Institute for Energy Research, European cities consume 70% of
the overall primary energy consumption of the continent, expected to reach
75% by 2030. Reduction of CO2 emissions is a priority in the EU. The Energy Performance Buildings Directive
(EPBD) requires from each member the establishment of a long term strategy
for investment in “green” interventions and improvements to the existing building
stock. Project Aim This thesis is focusing on the problem of energy consumption of the dwelling
stock in the urban environment, using
GIS to map energy consumption and calculate energy and CO2
emissions savings after certain
retrofitting measures. The overall aim of the project is to explore energy consumption patterns at urban scale and provide a methodology
for evaluating retrofitting scenarios and support decision making in the
context of location-based policy
implementation to promote effective, sustainable
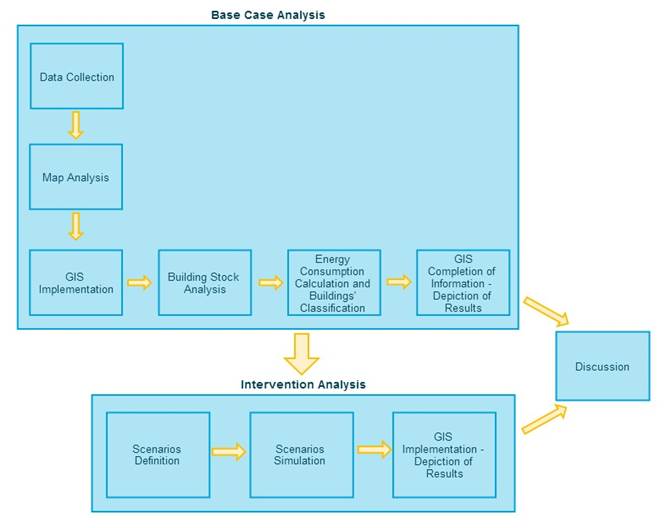
urban planning. Methods & Data The methodology
is based on a bottom-up, engineering-based approach, with the
use of representative building typologies - archetypes (Caputo et al., 2013). An overview of the methodology
is shown in Figure
1.
Figure 1 – Methodology approach This methodology is applied on the study area of Kos town in Greece. |
|||||||||||||
|
Figure 2 – The study area |
Figure 3 – Representative buildings
of the study area |
||||||||||||
|
The data about the population, the buildings and the
climate are collected from: ·
the Hellenic Statistical Authority; ·
Cadastral Authority and ·
Field surveys
in the area. The database is built on ArcGIS, to form an “energy
cadastre”. According to the results of stock analysis the representative
building typologies in the study area are identified, according to the
Hellenic and European standards (TABULA
project).
Table 1 – Archetypes of buildings in the study area
|
Figure 4 – Linking data to the database |
||||||||||||
|
The project follows the Hellenic legislative
framework and best practice in energy
auditing. Final energy calculations are performed on the TEE-KENAK simulation software – the
official software of the Technical Chamber of Greece (TEE) for the assessment
of energy performance of buildings. Scenarios Three
scenarios of retrofitting measures are defined according to current
policies and are simulated to calculate the new primary energy and CO2
emissions. The results are extrapolated to the whole building stock,
incorporated in the database and visualised on ESRI ArcMap.
|
|||||||||||||
|
Results &
Discussion |
|
||||||||||||
|
Energy Balance |
|
||||||||||||
|
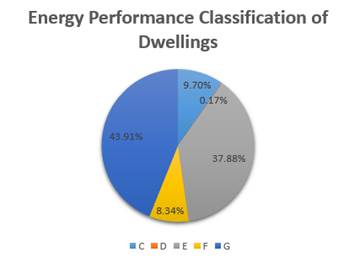
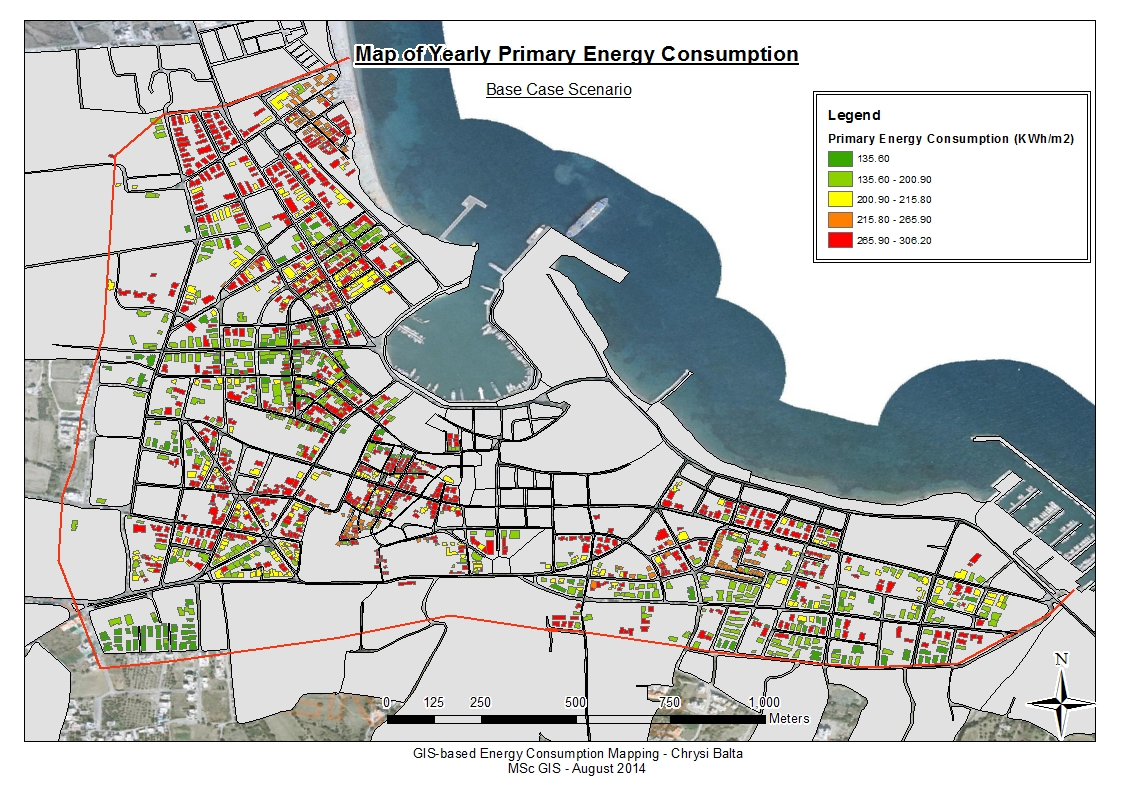
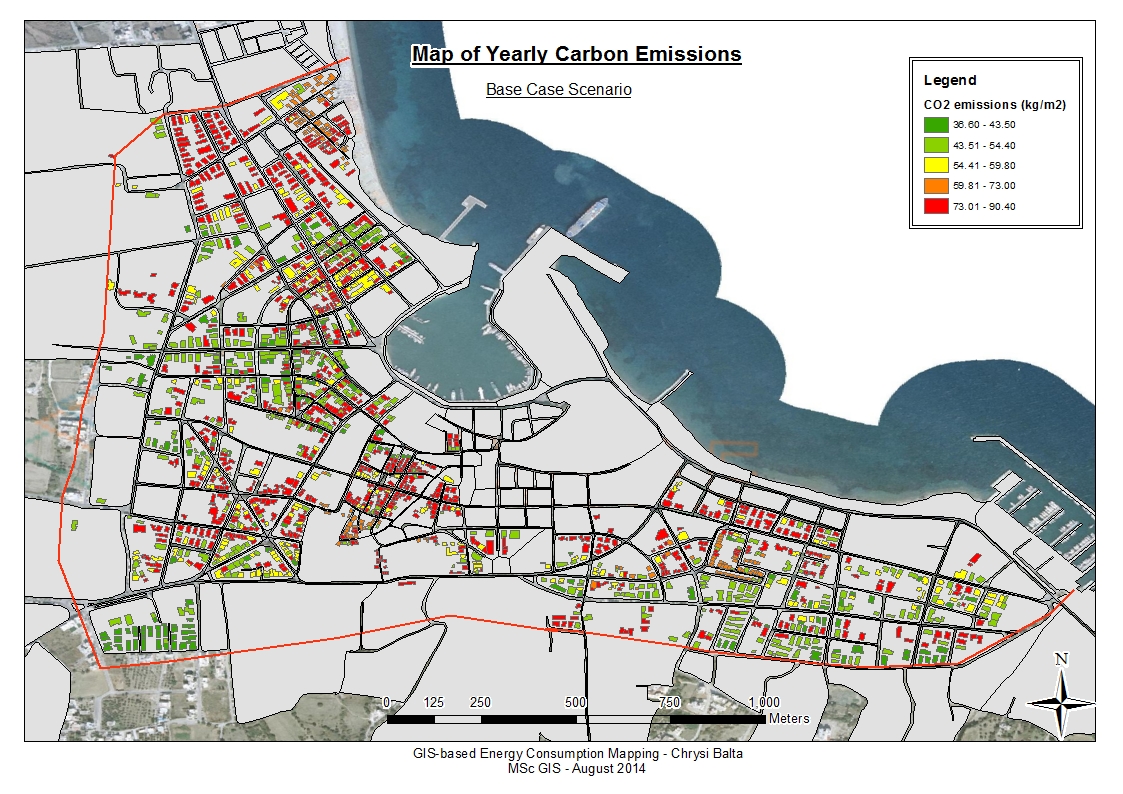
The results show that the current situation of the
building stock is highly
energy-consuming, because of the age
of the stock as well as the bad state
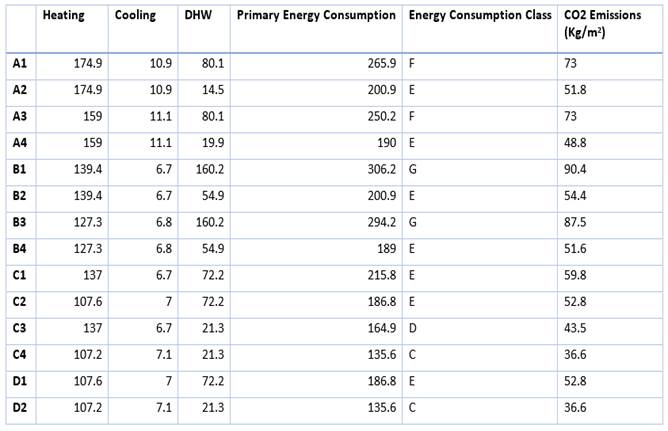
of maintenance. As seen in Table 2, archetypes A and B are proved to be the most energy-consuming,
due to their age and the change in building materials. Comparing to the
northern European housing stock, energy performance is lower as policies to
promote energy efficiency have not been implemented. 70% of energy consumption goes for space
heating, due to the lack of insulation and double-glazing. Space
cooling is accounting for 2.2%
to 5.2% of total yearly
consumption, as it is needed for only three months a year and is usually
provided by relatively new and efficient air-conditioning units.
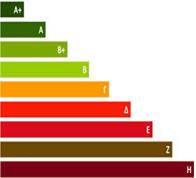
Figure 5 – Energy classification scale
Figure 6 – Energy classification
results |
Table 2 – Energy balance results
|
||||||||||||
|
Scenarios
Evaluation |
|
||||||||||||
|
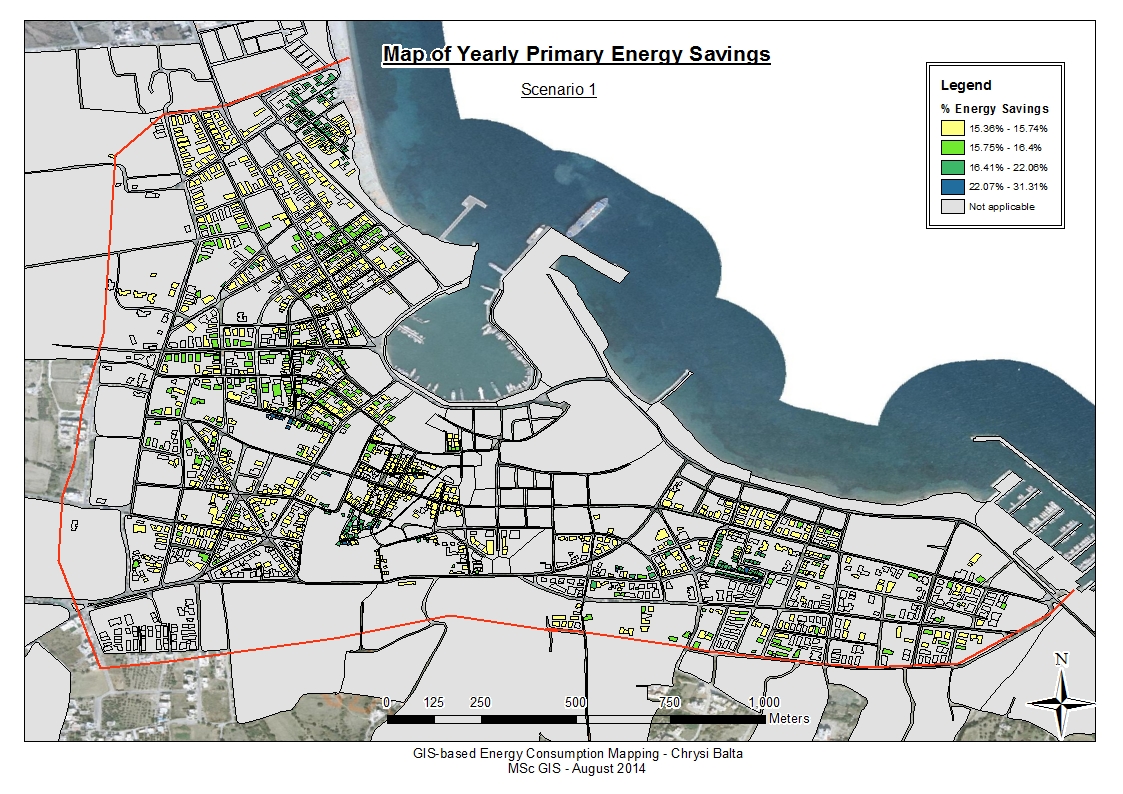
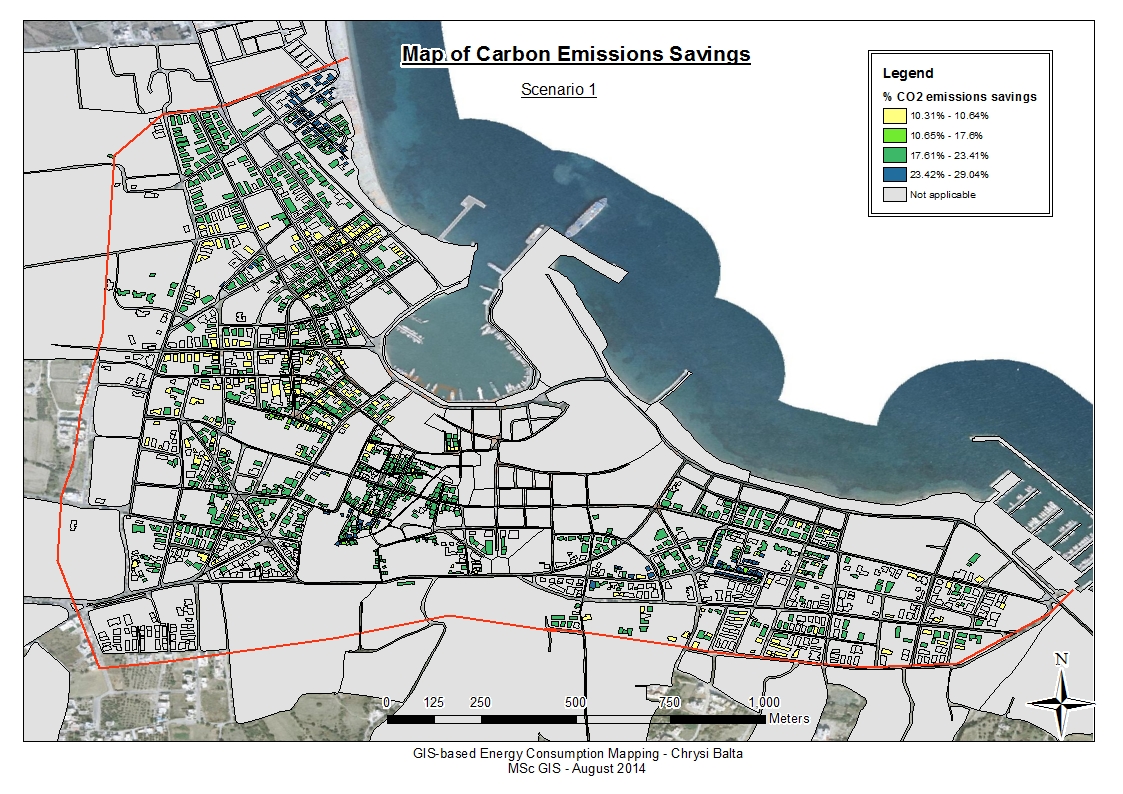
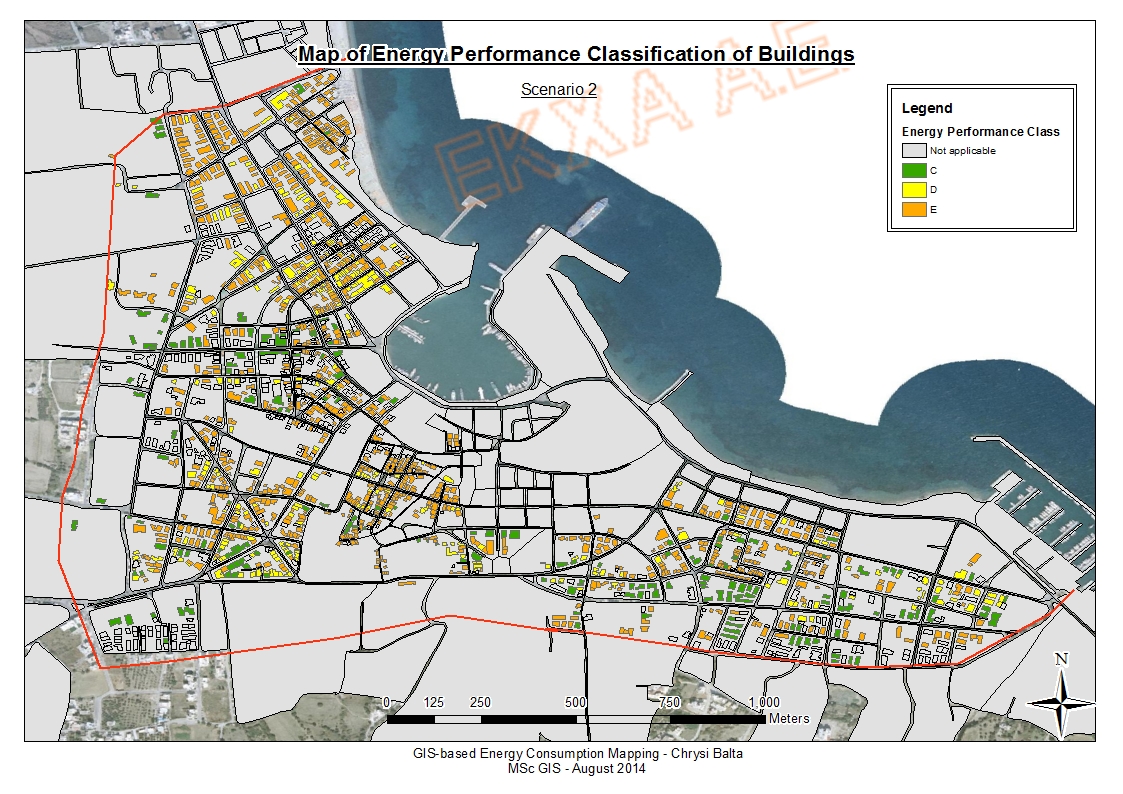
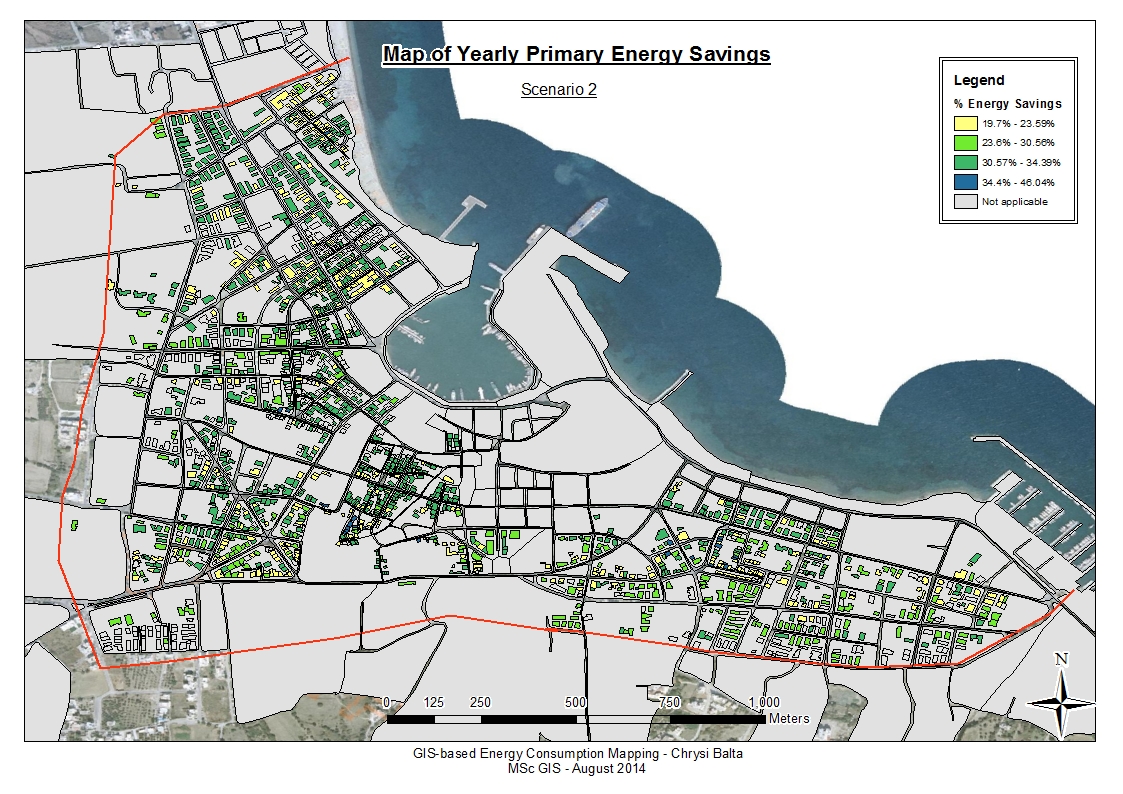
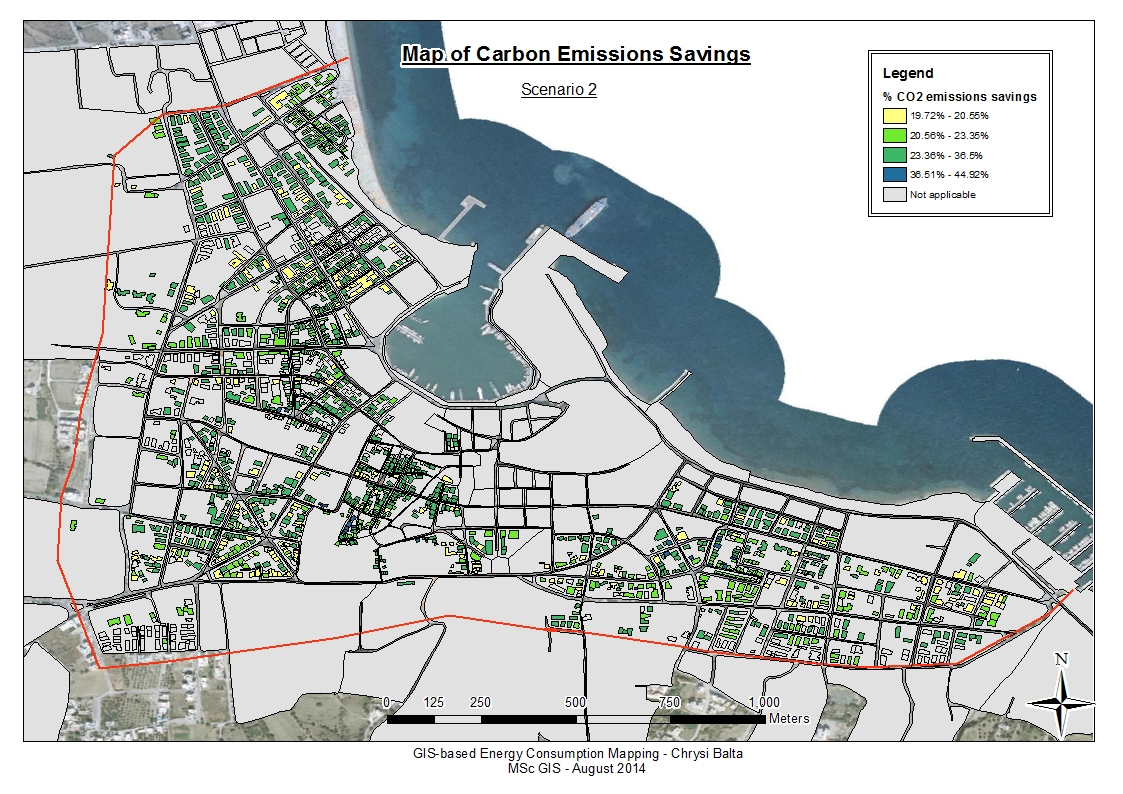
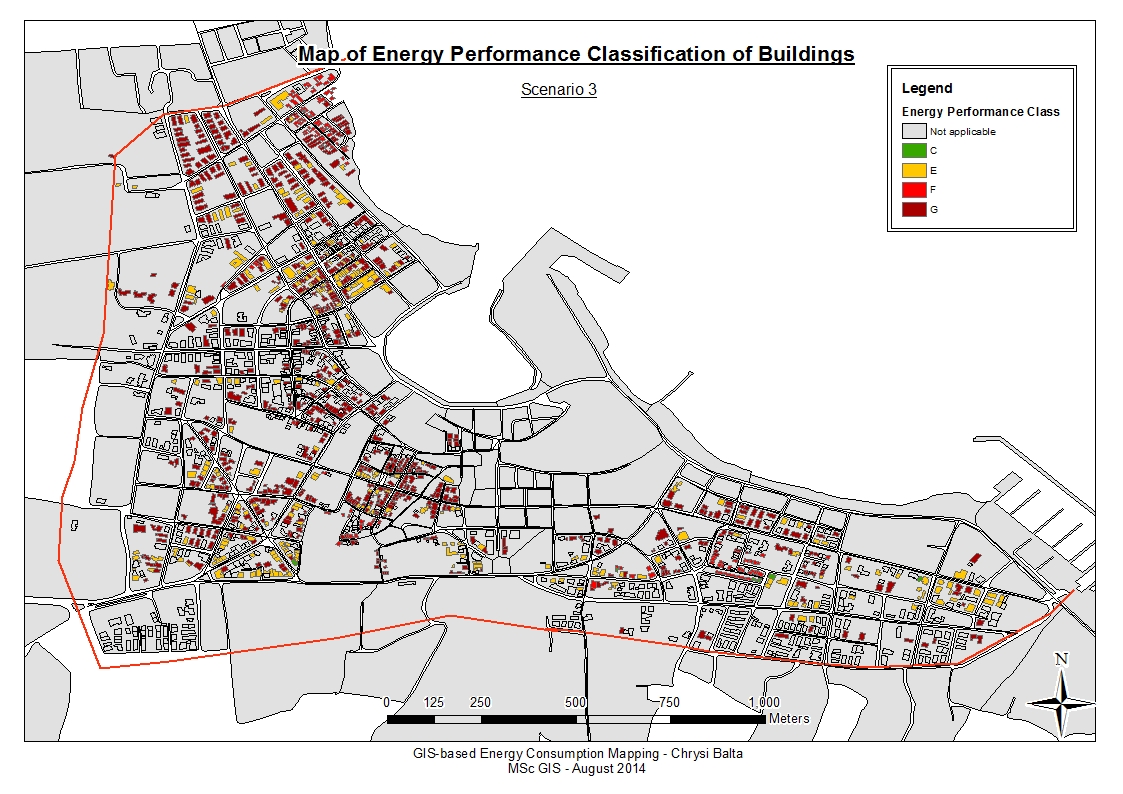
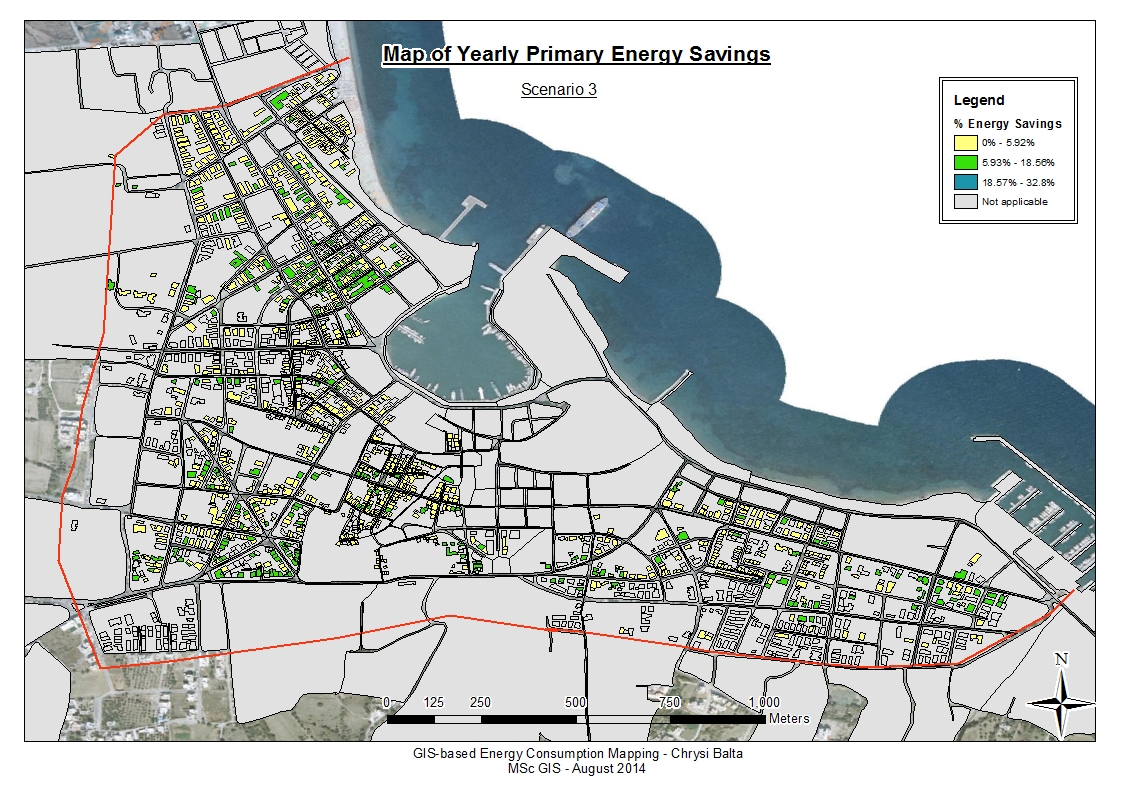
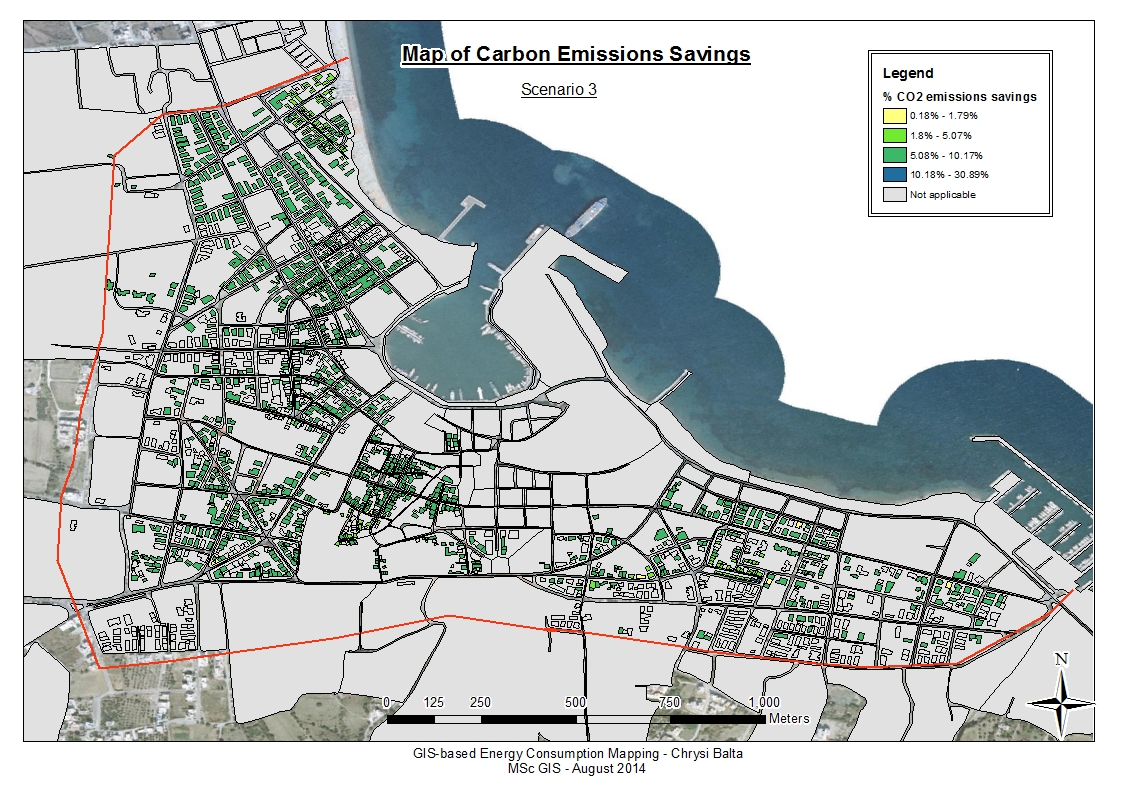
It is observed that the scenario of solar thermal
panels for DHW makes the most remarkable
difference at individual dwelling
level, reducing total electrical energy consumption
by 25-50% with a payback time of 2.5 years on average. However, at city
level, the insulation scenario
provides the greatest decrease of
heating energy demand and consequently of total energy consumption. This has to do with the fact that
almost 66% of the housing stock is
built before 1980, in the period of no
legal obligation for thermal
insulation. The effect of the different scenarios to energy and carbon
savings and performance classification can be observed in Figure 7. Overall, the decision for the best scenario is dependent on the final objective. For example, if local administrators want to achieve radical reduction in total primary energy consumption, the preferable choice would be scenario 1. On the other hand, if the objective is to involve the individual owner, then scenario 2 should be promoted. |
Figure 7 – Comparative view of the impact
of the 3 scenarios |
||||||||||||
|
Figure 8 - Clustering of consumption |
Clustering of Consumption |
||||||||||||
|
Clustering analysis identified areas at excessive
risk and great need for policy measures. Global Moran’s I shows that
consumption is clustered with a chance of less than 1% that this is a result
of randomness. Local indicators of clustering are used to detect
areas with excess consumption. Neighbourhoods are detected, where high
consumption clustering is noted. In yellow colour, individual buildings are
shown, which can be targeted due their relatively high energy consumption
compared to their neighbours. |
|||||||||||||
|
Conclusions |
Key References |
||||||||||||
|
The housing
sector in Greece is problematic
in terms of energy consumption, with little use of the available renewable
resources that needs to be improved, due to article 9 of the directive
2010/31/EU. New policies have to be implemented for environmental and social
reasons. This bottom-up,
engineering approach for mapping energy consumption with the use of building typologies, adapted to the
characteristics of the city, proved to be efficient and in connection to GIS
provides a way to compare
different retrofitting scenarios, observe
the different results in space and detect
areas at excess risk. This database can facilitate the Energy Performance Certification, make it faster and cheaper and
reduce the costs of real estate transactions This could be improved with the increasing
availability of data about the buildings and consumers’ behaviours. An INSPIRE compliant solution would
maximise the pace of changes, as the public becomes more informed and engaged
to the project of zero-energy buildings. This methodology can be adapted to every city and national
context, considering its special characteristics and practices. It assists
local authorities, which have an important role in the implementation of
energy policies and energy planners, local administrators and other
stakeholders who can take more effective actions at managing their stock. |
Caputo P., Costa G., Ferrari S., 2013. A supporting method for defining energy strategies in the building sector at urban scale. Energy Policy, 55, 261-270. Dall’O’ G., Galante A., Pasetti G., 2012a. A methodology for evaluating the potential energy savings of retrofitting residential building stocks. Sustainable Cities and Societies, 4, 12-21. Daskalaki, E. G., Droutsa, K., Gaglia, A., Balaras, C.A., Kontoyiannidis S., 2011. Building typologies as a tool for assessing the energy performance of residential buildings – A case study for the Hellenic building stock. Energy and Buildings, 43, 3400-3409. Ministry of Environment, Energy and Climate Change (YPEKA), 2012. [Energy efficiency at buildings – The programme guide]. Athens: YPEKA (in Greek). Theodoridou, I., Papadopoulos, A.M., Hegger, M., 2011. A typological classification of the Greek residential building stock. Energy and Buildings, 43, 2779-2787. |
||||||||||||
|
|
|||||||||||||
|
Chrysi Balta - MSc GIS |
|||||||||||||