|
|||
CityFIT Urban Guide: Modelling and Deploying indicators of Property Exposure to Flooding in Lagos using LIDAR DEM and DSM data |
|||
Sulaiman Mosuro |
|||
RESEARCH CONTEXT The prevalence of flood following heavy precipitation is a vivid and daunting problem in the coastal city of Lagos mostly exacerbated by restricted drainage channels, poorly engineered structures, urbanization processes and the uncontrolled siting of buildings on flood plains. An understanding of floodplain characteristics and storm water flow mechanisms is essential in the efficient management of urbanizing cities. Flood prediction models benefits in giving informed guidance aimed towards ameliorating the impacts of inundation hazards in urbanizing areas as it aids in the capacity for timely public enlightenment on potential flood hazards raising preparedness and minimizing loss.The propagation of flood inundation in urban catchments is highly dependent on the surface topography, land cover and the representation of structure in elevation data used in modelling. Components of flood prediction modelling addressed by this project include determining:
PROJECT OBJECTIVES
|
|||
STUDY AREA, DATA AND METHODS |
|||
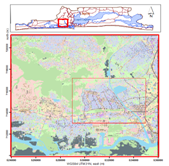
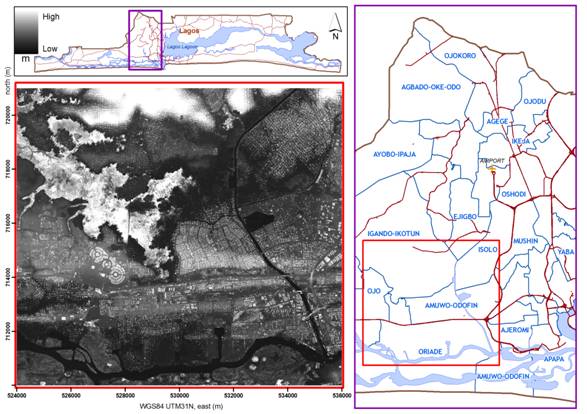
A case study area of 132km2 lying between 3.22° - 3.23° E and 6.42° – 6.52° N in Lagos Nigeria is selected for this research.
|
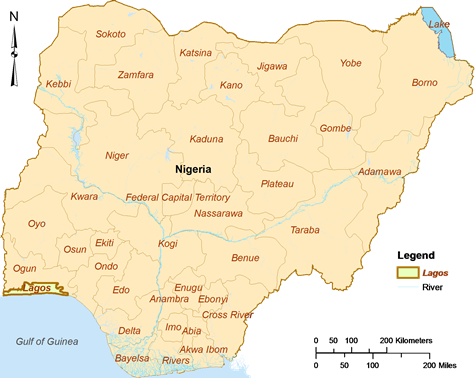
Figure 1: Map of Nigeria showing Lagos State |
||
Figure 2: LIDAR DSM of Study site in context of the whole State |
|||
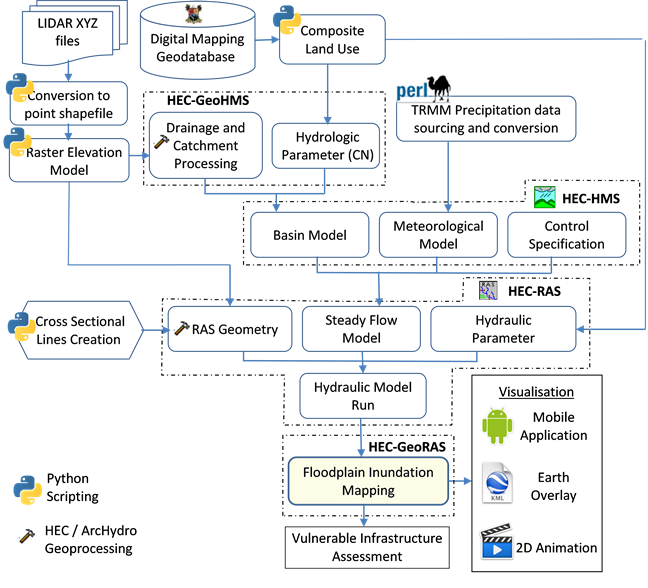
Modelling processes are executed using HEC Tools including HMS, RAS, GeoHMS and GeoRAS. Intermediate procedures including the creation of steady flow cross-section geometric data, composite land use etc. were automated using scripts (python and perl) developed in this research. Thw modelling workflow is outlined in the Figure below
Figure 3: Workflow chart for flood inundation modelling, analysis and deployment |
|||
RESULTS |
|||
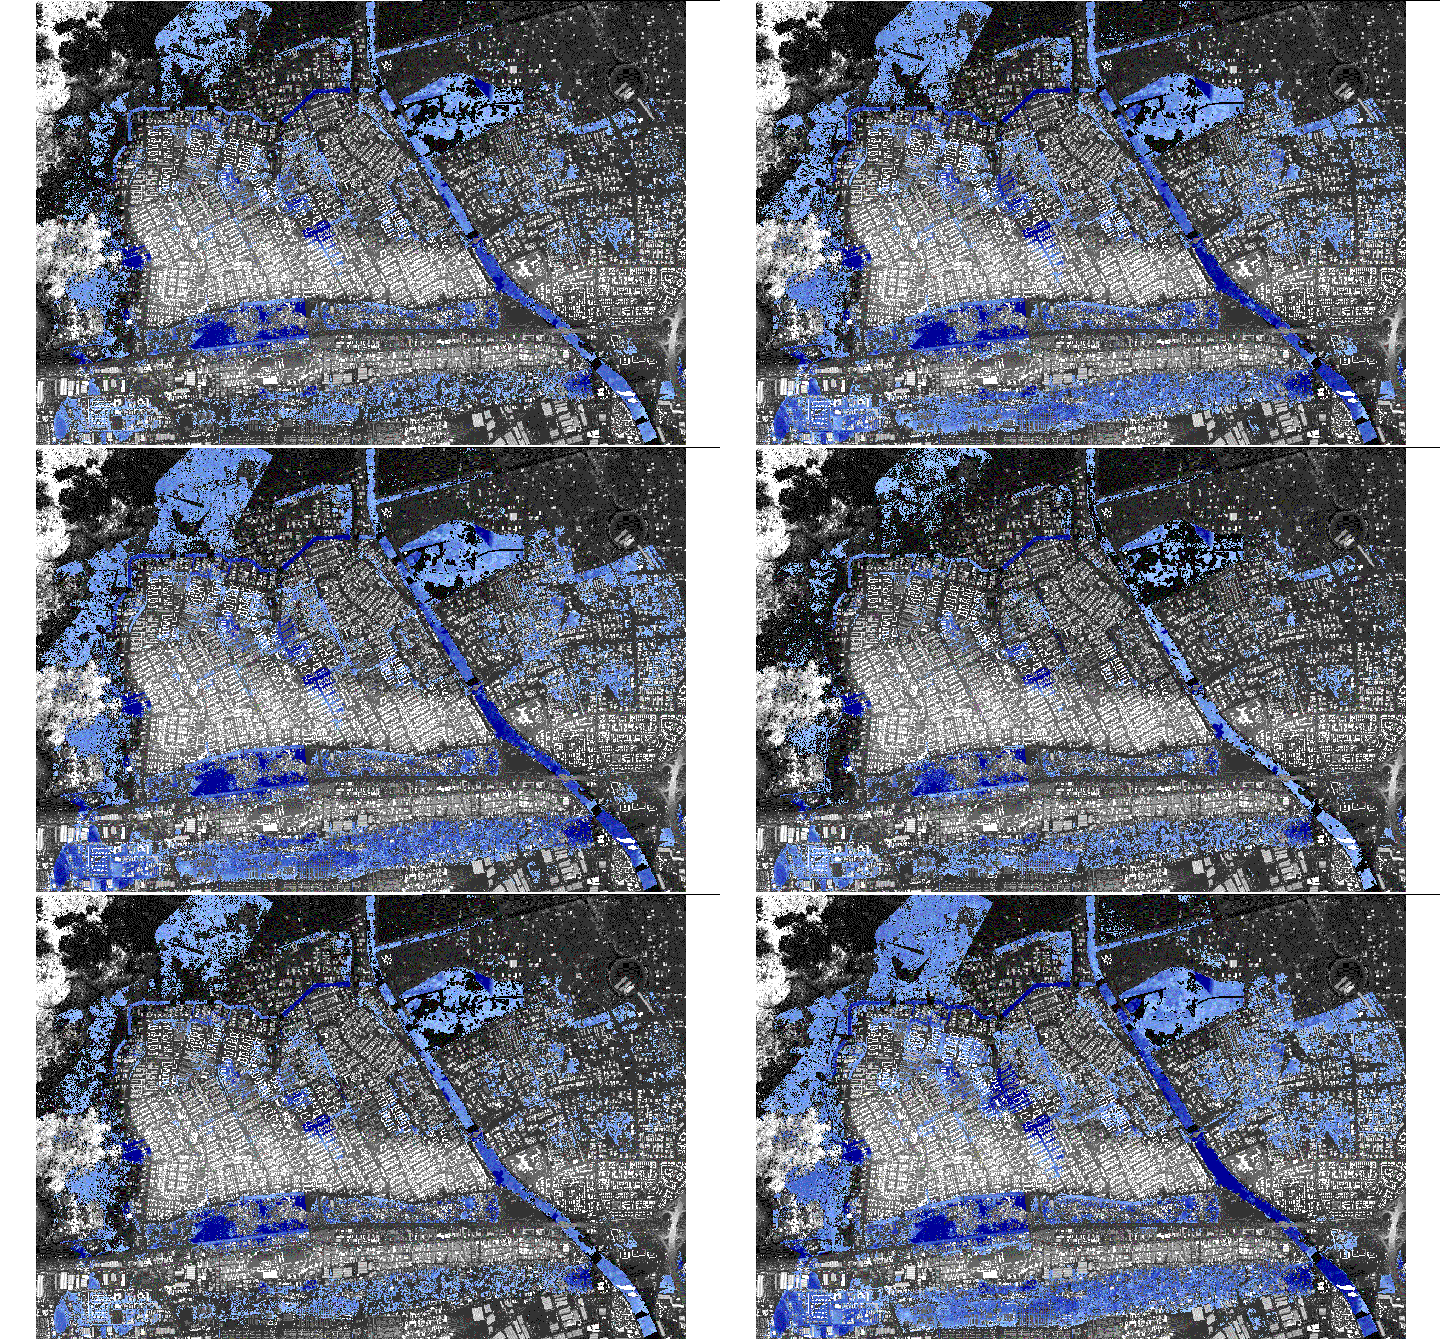
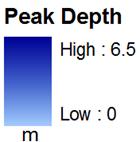
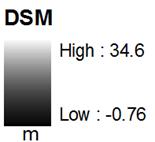
Figure 4: Map of flood depths over time for the July 10, 2011 event, overlaid on DSM |
|
||
 |
|||
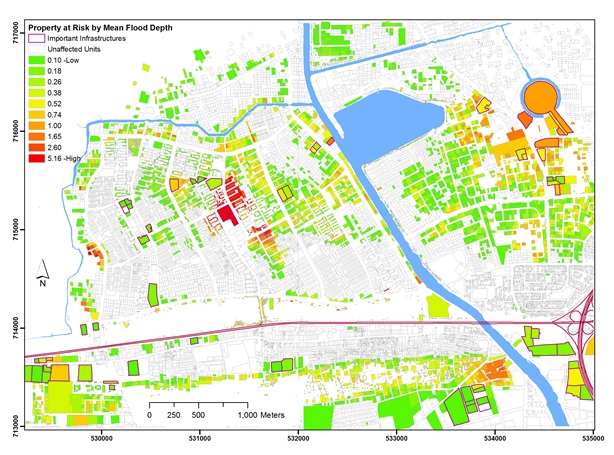
Property risk levels were mapped by associating exposure indicators of flood depth and flow velocities to units of the address parcel layer. The ratings were based on the magnitudes of these flood characterisitics in the neighbourhood of the affected units.
Figure 5: Map showing risk levels associated to Properties and Infrastructure based of Flood depth Inundation extents and flood depths for DSM profiled models cover larger areas than that of their counterpart DEM runs. This is as a result of the fact that structure present in the DSM reduces area that can be occupied by flood water thereby increasing depth and coverage
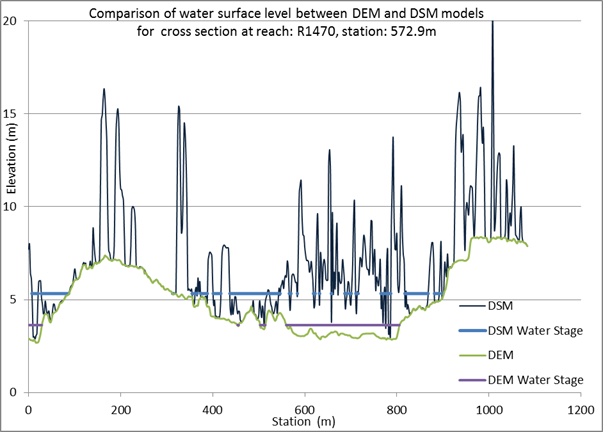
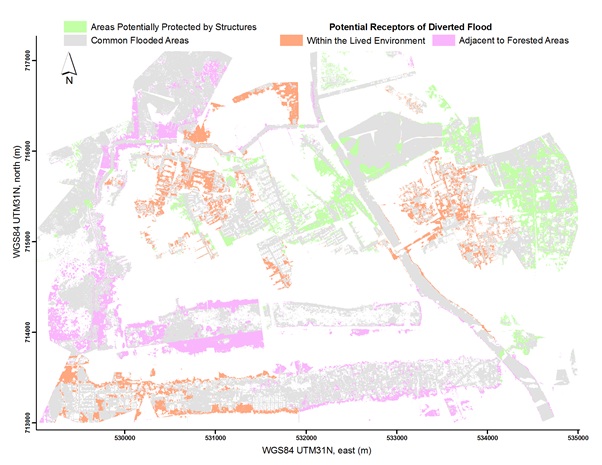
Figure 6: Comparison of water stages derived from DEM and DSM model simulations for the same rainfall volume A symmetric difference of the DEM profiled floodplain, with that of the DSM resulted in a layer showing areas potentially protected by presence of structures and the zones that are potential receptors of diverted flood due to structural influence on the flow propagation
Figure 7: Map showing structural influence on flood propagation created by a symmetric difference of the flood extents maps from DEM and DSM models |
|||
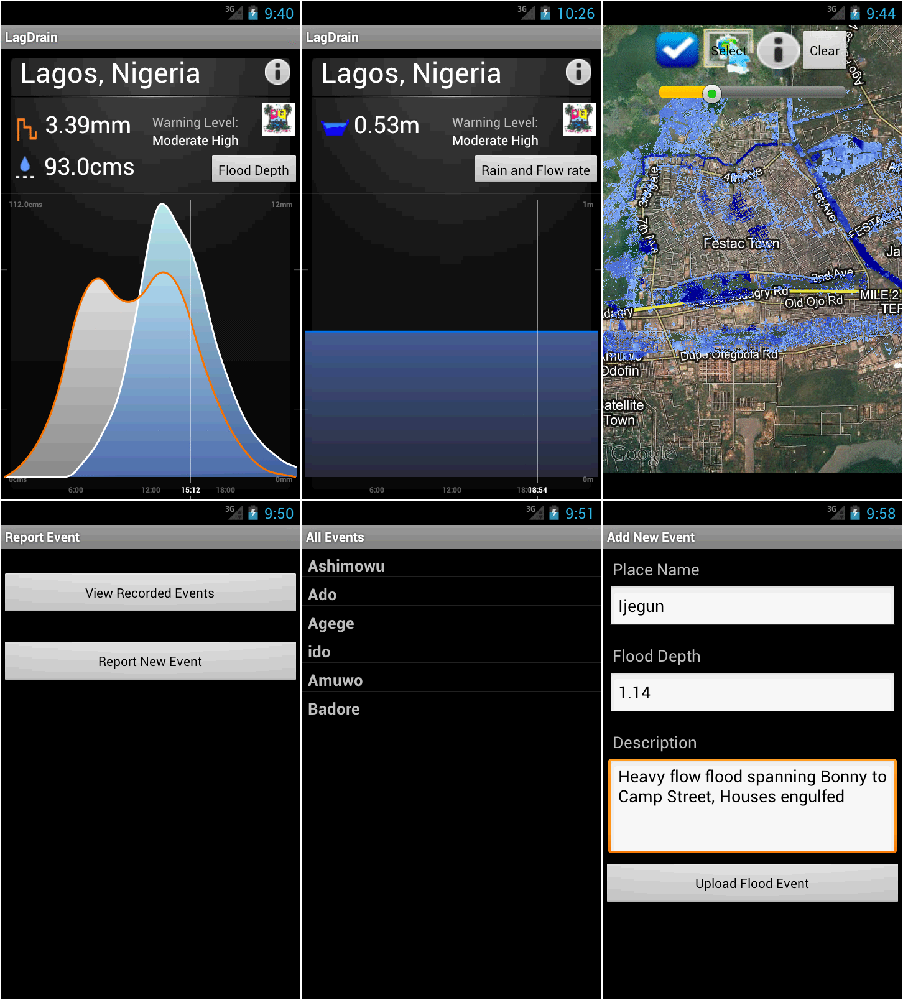
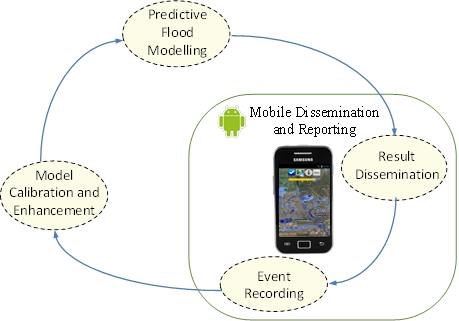
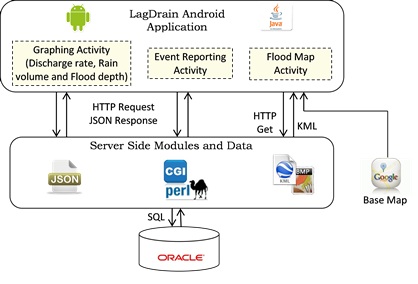
RESULT DISSEMINATION A portable android application was prototyped for disseminating time-series flood model information and for reporting details of flood events as they occur to serve for model calibration and enhancement, thereby completing the flood modelling lifecycle.
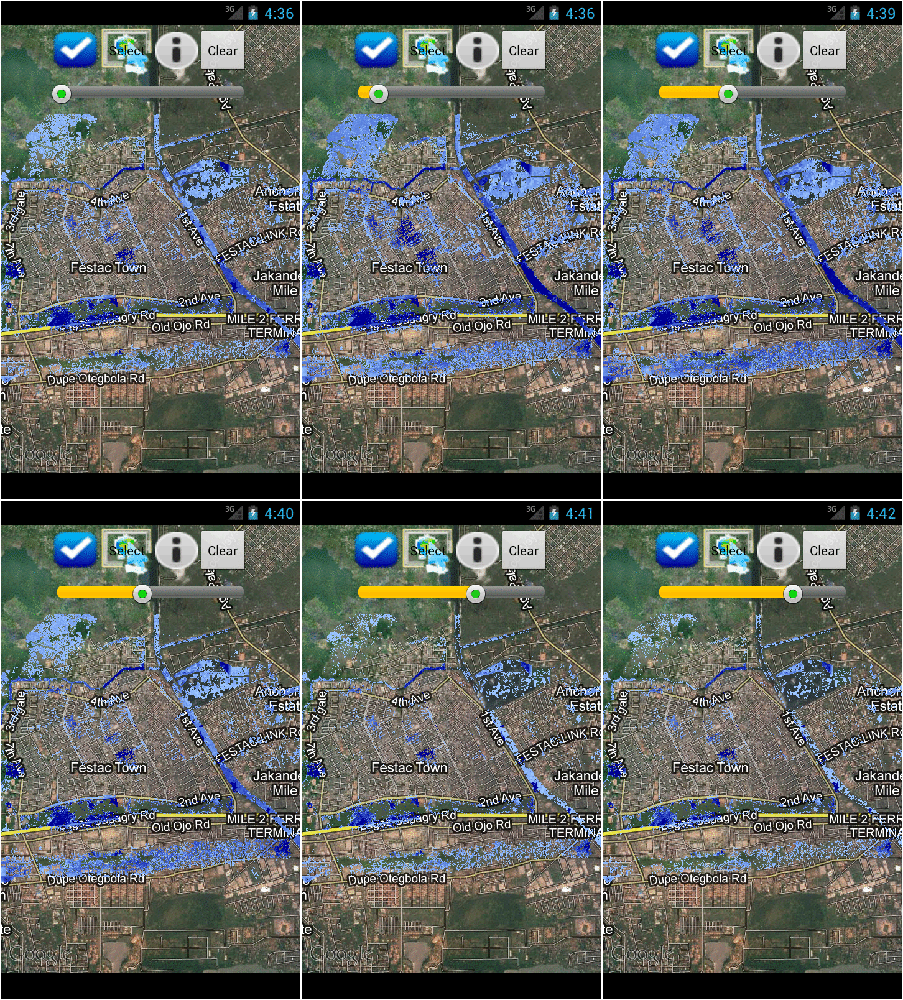
Figure 8 and 9: Flood Modelling Lifecycle, showing the utility of mobile devices for dissemination and reporting; Architecture of developed mobile application showing the methods and data it utilizes for result visualisation and event reporting A graphing activity displays charts of discharge rates, precipitation volume and flood depths over the time period of the event. The map interface contain flood extent layers simulated at specific time steps navigable using the seek bar and overlaid on a google satellite base map.
Figure 10 and 11: Android activities showing graph plots of discharge rate, rainfall and flood depths; flood map overlays and event reporting forms. A touch motion on the graph changes the text displays to those of the current time position. The map activity shows an overlay of flood extent navigable over time using the seek bar/time glider. Map tools allow toggling layer and interactive selection on map to reveal additional information |
|||
CONCLUSION This research saw the creation of a floodplain inundation model suitable for predicting the propagation of flood and the influence of structural form to the flow dynamics of inundation in the study site. The model consists of a hydrologic component that returns the discharge hydrograph of the runoff from precipitation events factoring processes of infiltration loss, concentration lag and topography. The hydraulic component determines water surface levels, flow velocities and flood depths of the inundated area over time. |
|||
REFERENCES ACKERMAN, C. 2011. HEC-GeoRAS–GIS Tools for Support of HEC-RAS using ArcGIS, User's Manual. US Army Corps of Engineers, Hydrologic Engineering Center (HEC), Davis, CA. |
|||

