Mapping the Phenology of European Honey Bee Nectar Flows
William Blomstedt

Abstract
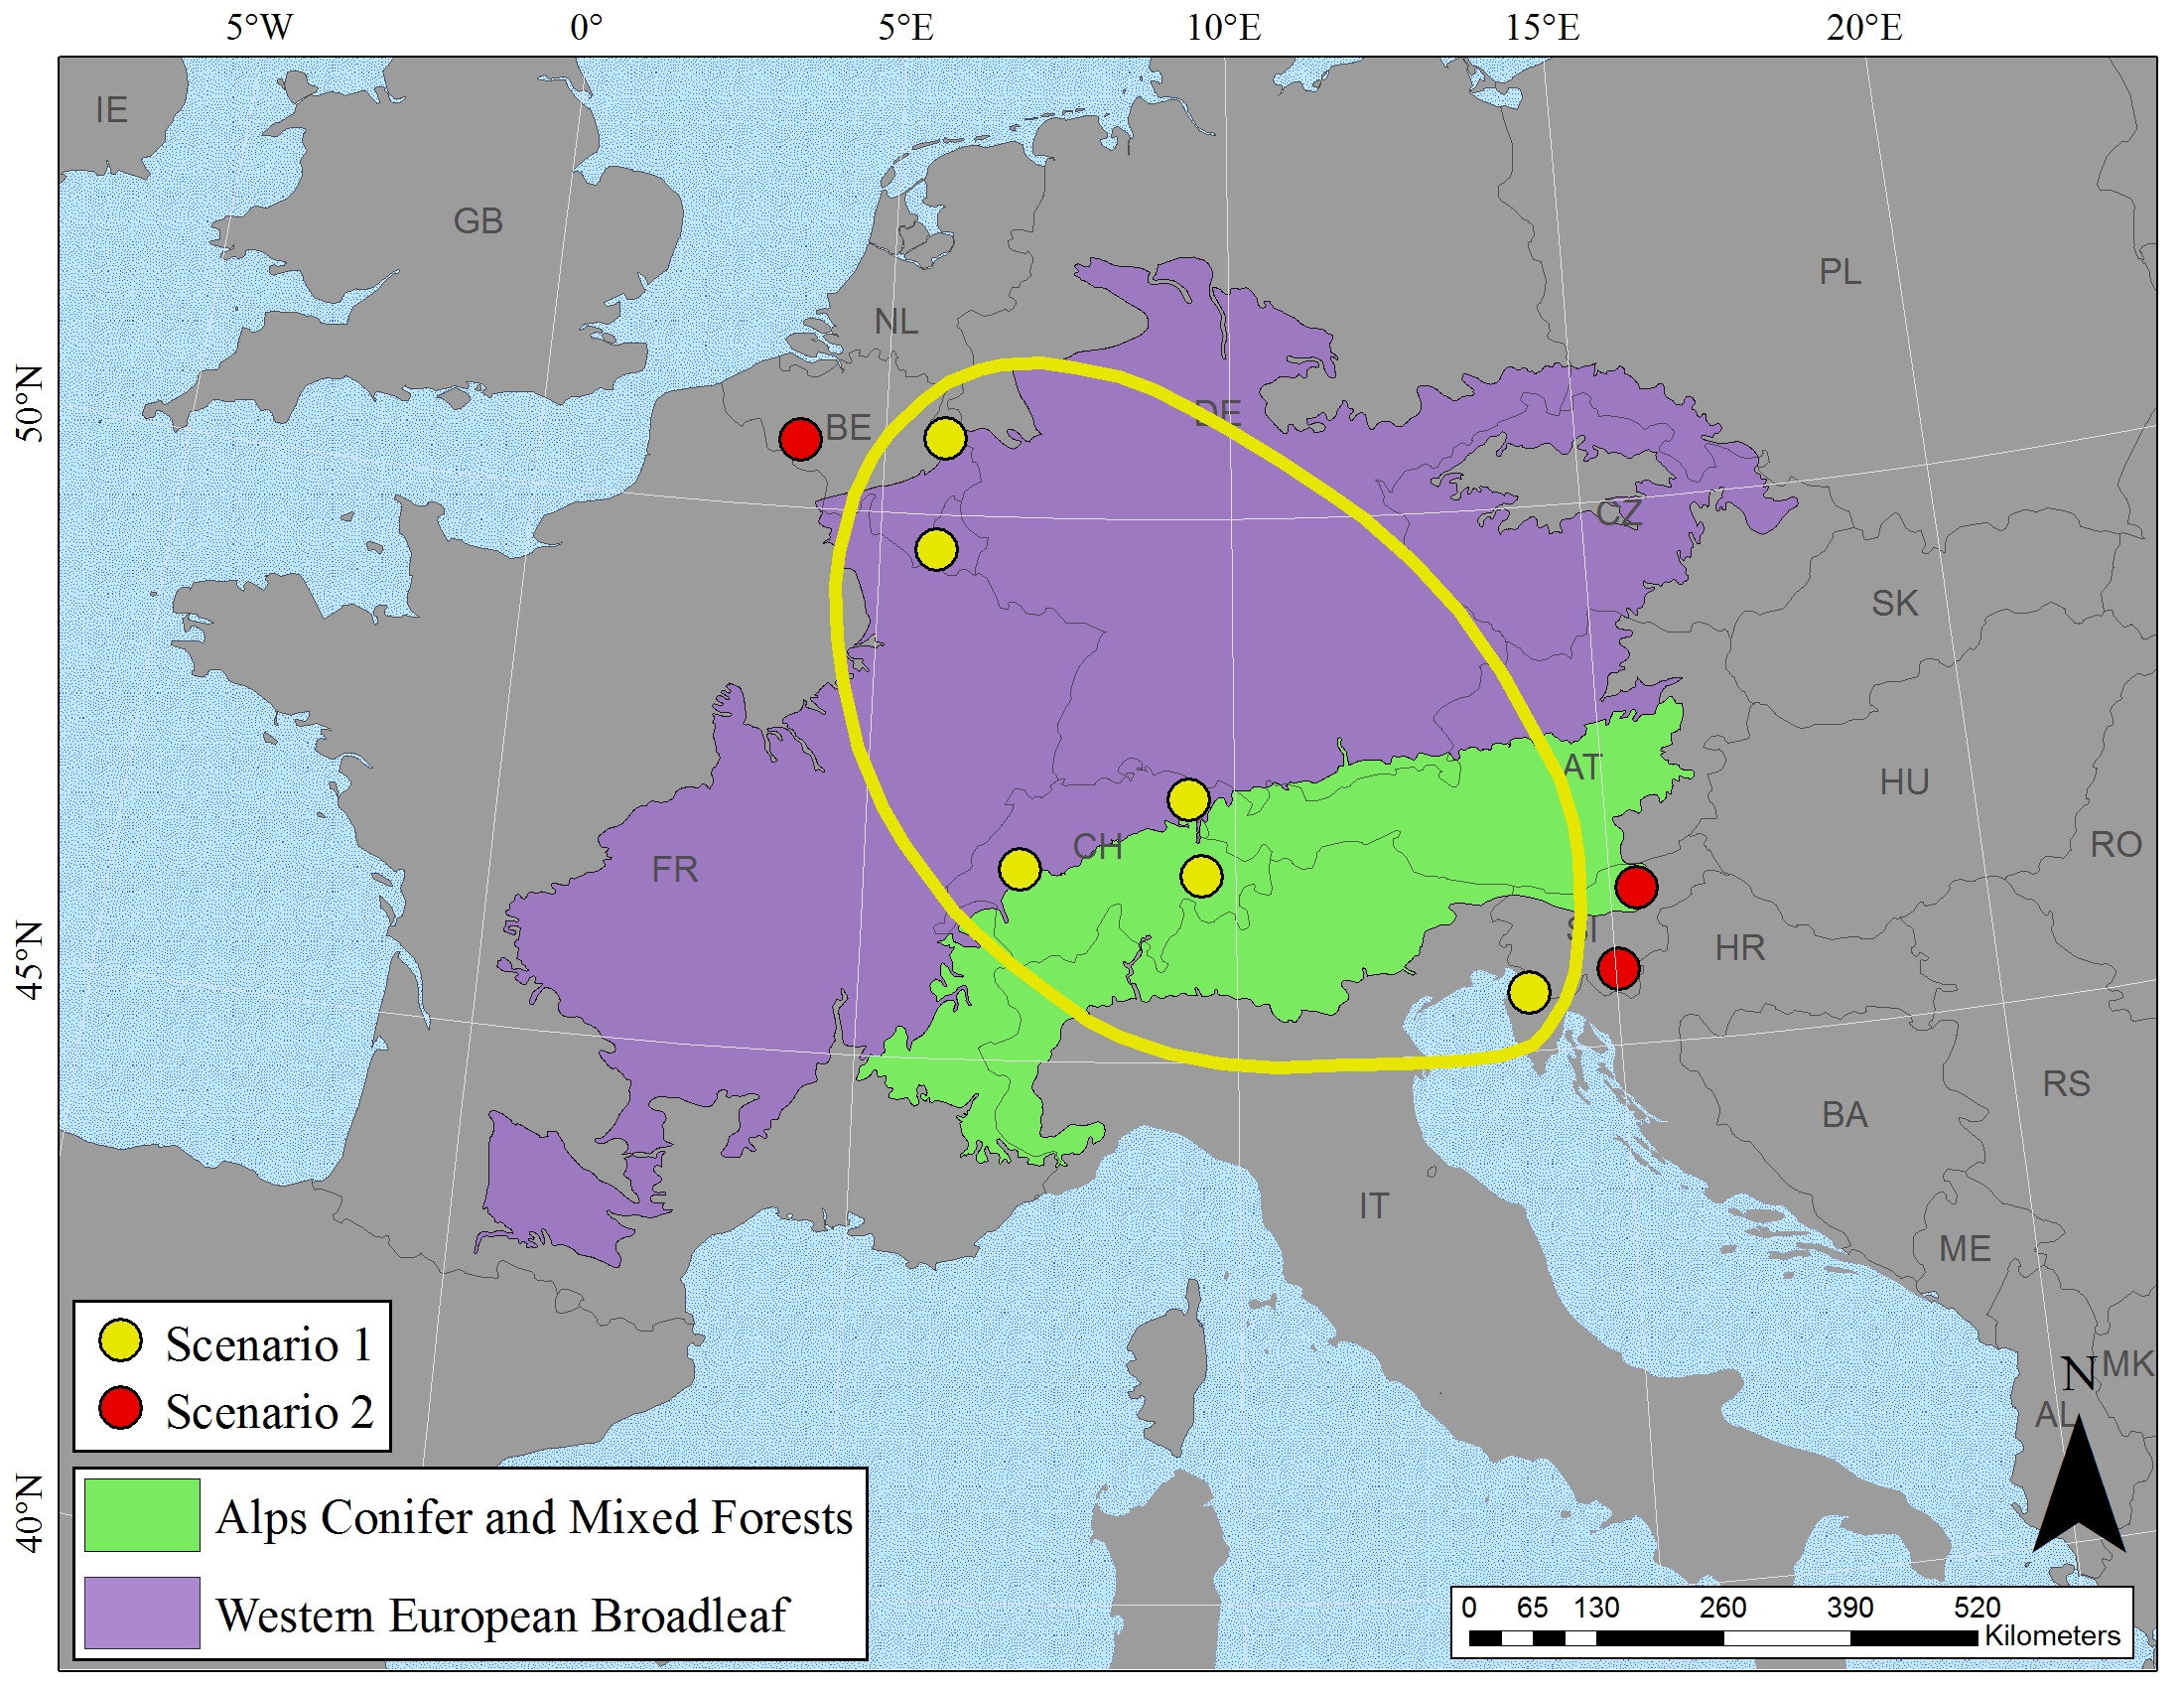
Insect pollination is vital to both the health of our ecosystem and food production. Consequently, it is important to understand how the phenology of both pollinators and plants will be influenced by global climate change. Current satellites allow a near-daily synoptic view of the entire earth, but it is difficult linking the imagery with in situ events because of the difference in scale between a point and pixel. Due to their generalized foraging on a variety of plants in the 100 km2 surrounding their hive, honey bees operate at a scale which may be compared to satellite data. The MODIS Aqua and Terra satellites produce daily images of the earth and the Normalized Differentiation Vegetation Index (NDVI) is able to show the “green-up” or start of spring (SOS). Locally, the phenology of nectar-producing flowers can be inferred from the honey bee nectar flow (HBNF), which is measured by the weight gain of a honey bee hive. This research investigates the link between smoothed, gap-filled NDVI data, and weight gain of hives in Slovenia, Switzerland, Belgium and Finland during 2009-2012. No correlation was found between the SOS and HBNF start day, but a notable relationship (R2=0.73) was seen between NDVI SOS and HBNF midpoint (50% day) within the Alps and broadleaf forests of central Europe. This indicates that HBNF can be related to continental MODIS climate models, and that nectar flows have been advancing 0.6 to 0.8 days per year in central Europe.
< |
 |