|
|
|
A Phylogeographic Study of
the Tiger (Panthera tigris):
Using Holocene Distribution Models to Assess Late Pleistocene Range Shifts |
|
David Matthew Cooper |
|
Assessing tiger distributions through the Late Pleistocene
can provide insight to the evolutionary histories of currently recognized
tiger subspecies. If global tiger ranges have been continuous, and not
sufficiently isolated through glacial or interglacial periods, then there
should be fewer subspecies than those currently recognized. This paper uses a
phylogeographic approach, by modelling tiger
distributions for the present day and the Last Glacial Maximum using a
maximum entropy framework. Models of the present day and the Last Glacial
Maximum have been used to represent interglacial and glacial conditions for
the Late Pleistocene respectively; especially with regard to the
environmental conditions before and after the ~73ka super-eruption of Toba on
the Island of Sumatra. Using models based on 9 bioclimatic variables, tiger
range is continuous from the Indian Subcontinent to northeast Siberia during
present day conditions. Last Glacial Maximum distributions are reduced to a
core, southern area of the Indian Subcontinent and Southeast Asia. The 73ka
volcanic eruption of Toba may have reinforced the separation of mainland and
Island tigers by drastically reducing tiger populations to southern China and
the Islands of Java and Bali. These findings support a growing number of
geographic, genetic and morphological studies which call for a reduction in
subspecies based on a lack of evidence for their unique evolutionary
histories. A single mainland subspecies and a single Sunda
Island subspecies is proposed by this study. |

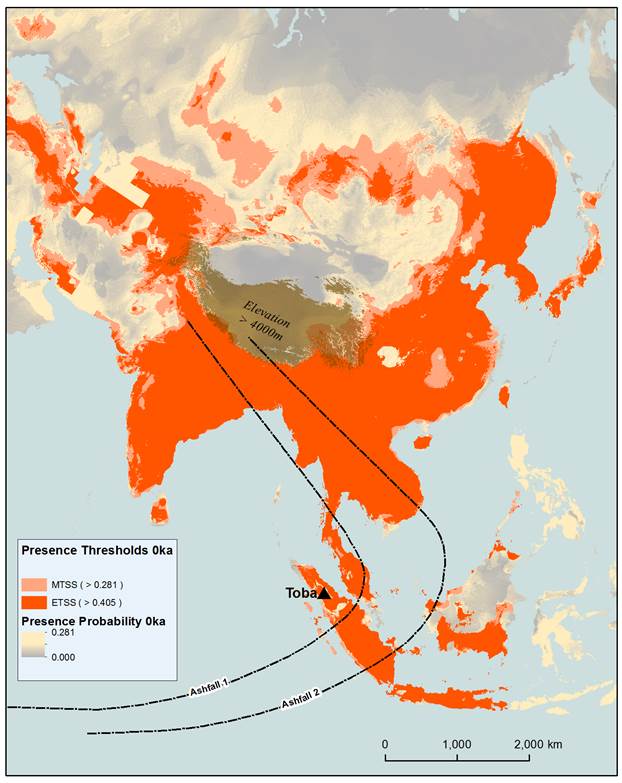
Figure 1: Modelled tiger distribution
based on 9 bioclimatic variables for the present day. Equal training
sensitivity and specificity (ETSS) and maximum training sensitivity plus
specificity (MTSS) presence thresholds have been applied to the maxent logistic values (presence probability). Logistic
values below the presence thresholds have been included to indicate areas where
the habitat is more or less conducive to dispersal. The site of the 73ka Toba
eruption, in addition to known (Ashfall 1) and
possible (Ashfall 2) distributions of ash fallout
(Self, 2006) following the eruption are presented. Elevations of over 4000m
have been included as a possible barrier to dispersal.
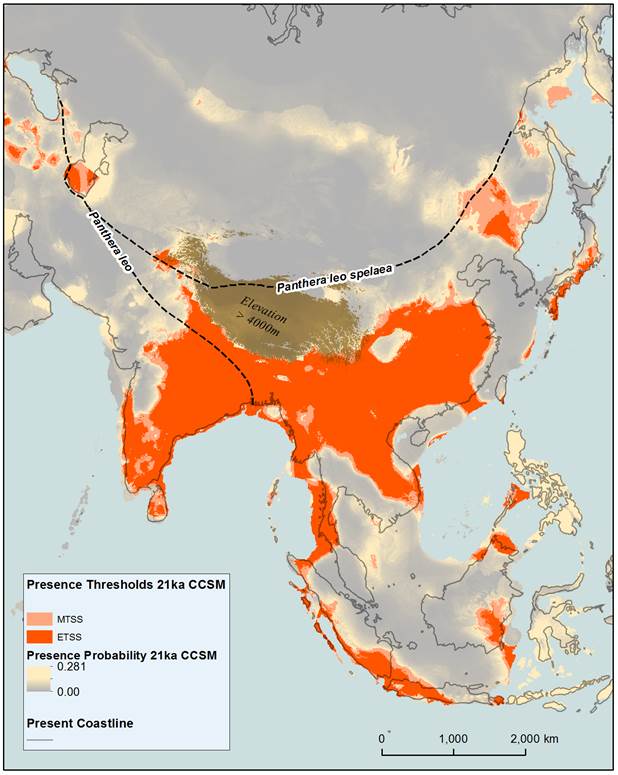
Figure 2: Modelled tiger distribution based on 9 bioclimatic variables for the LGM. The bioclimatic variables have been derived from the CCSM coupled general circulation model for 21ka. Equal training sensitivity and specificity (ETSS) and maximum training sensitivity plus specificity (MTSS) presence thresholds have been applied to the maxent logistic values (presence probability). Logistic values below the presence thresholds have been included to indicate areas where the habitat is more or less conducive to dispersal. The eastern extent of the ancestors of the modern lion (Panthera leo), and the southern extent of the Eurasian cave lion (Panthera leo spelaea) (Barnett et al., 2009) have been included to indicate areas of potential competition during the Holocene.
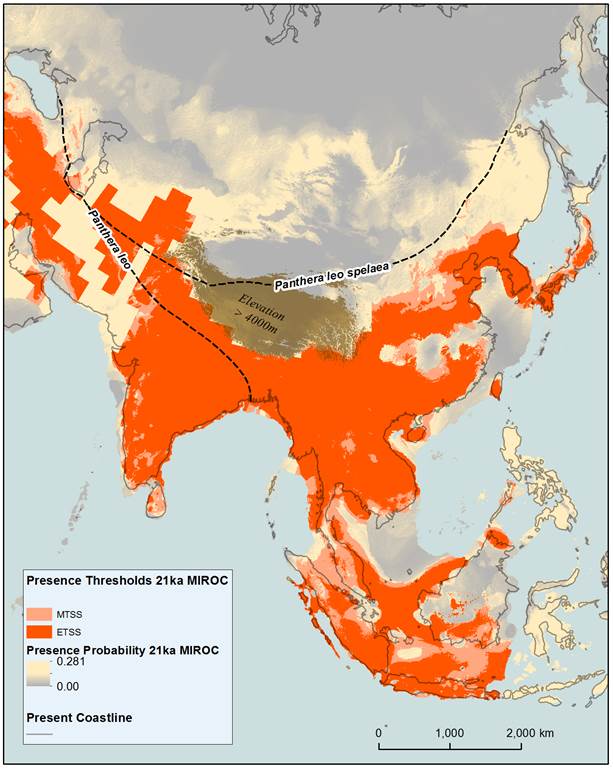
Figure 3: Modelled tiger distribution based on 9 bioclimatic variables for the LGM. The bioclimatic variables have been derived from the MIROC coupled general circulation model for 21ka. Equal training sensitivity and specificity (ETSS) and maximum training sensitivity plus specificity (MTSS) presence thresholds have been applied to the maxent model logistic values (presence probability). Logistic values below the presence thresholds have been included to indicate areas where the habitat is more or less conducive to dispersal. The eastern extent of the ancestors of the modern lion (Panthera leo), and the southern extent of the Eurasian cave lion (Panthera leo spelaea) (Barnett et al., 2009) have been included to indicate areas of potential competition during the Holocene.