17. Investigating Emergent Lengthscales with Spectral Analysis
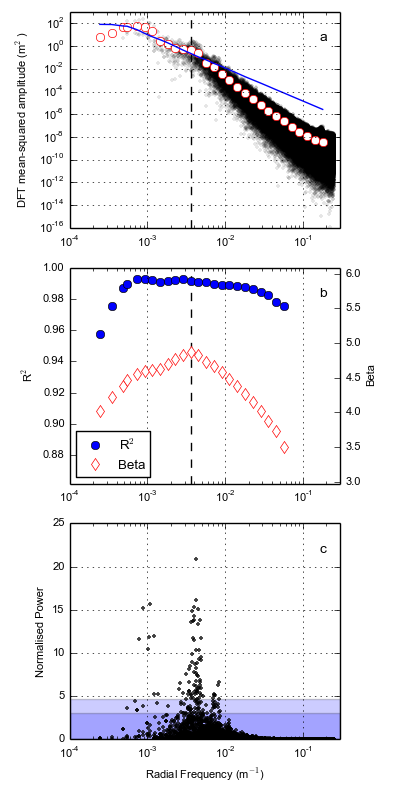
Here we expain how to perform spectral analysis in order to investigate the emergent lengthscales of a landscape, following the method outlined by Perron et al. (2008). We strongly recommend reading this paper before interpretting the spectra, so that you have an idea of what it is that you are looking at!
The outputs from the function are:
- A .txt file containing the radial spectrum of the landscape, calculated using the forward fast fourier transform
- A .txt file containing the binned spectrum
17.1. Compiling the driver function
The driver function, Spectral_analysis_Perron_driver.cpp, can be compiled following the same procedure outlined in previous tutorials.
17.2. Running the driver function
Okay, now you are ready to run the driver function. You’ll need to run the function from the directory where the compiled code is located (i.e. the driver_functions folder), but it can work on data that is located in any location. In addition, the code requires the use of a driver file, containing some important information required by the code. An example has been provided: Spectral_analysis_Perron.driver. There are 7 lines with two columns. first column just has the variable name, to be helpful in case you ever need to read it again and work out what is what. The second column has the variable value:
path <path_to_data>
RasterID <raster_name>
OutputID <output_path_and_prefix>
N_iterations_fractal_estimation <number_of_iterations_to_produce_background_spectrum>
window <window_type 1=Hann Window (recommended); 0 = no window>
LogBinWidth <log_bin_width for binned spectrum (recommend 0.1)>
RasterExtension <raster extension, choices are 'flt', 'float', 'bil' or 'ENVI' (these are not case snesitive)>
You run the code with the command:
./Spectral_analysis_Perron_driver.out DirectoryContainingDriverFile DriverFileName
17.3. Program outputs
The swath_profile_driver tool creates two raster datasets, so you can check the swath templates yourself to better understand how the profiles are constructed
- *_radial_PSD.txt is the radial periodogram
- *_binned_radial_PSD.txt is the binned radial periodogram
Both of these files are utilised by the plotting script: plot_spectra_Perron.py